

| << Chapter < Page | Chapter >> Page > |
The shaded area in the following graph indicates the area to the left of x . This area is represented by the probability P ( X < x ). Normal tables, computers, and calculators provide or calculate the probability P ( X < x ).
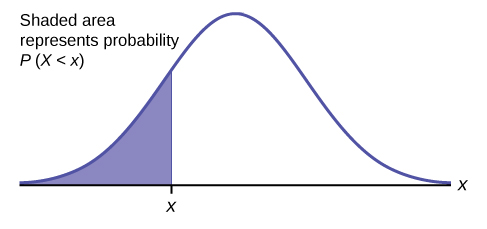
The area to the right is then P ( X > x ) = 1 – P ( X < x ). Remember, P ( X < x ) = Area to the left of the vertical line through x . P ( X < x ) = 1 – P ( X < x ) = Area to the right of the vertical line through x . P ( X < x ) is the same as P ( X ≤ x ) and P ( X > x ) is the same as P ( X ≥ x ) for continuous distributions.
Probabilities are calculated using technology. There are instructions given as necessary for the TI-83+ and TI-84 calculators.
To calculate the probability, use the probability tables provided in [link] without the use of technology. The tables include instructions for how to use them.
If the area to the left is 0.0228, then the area to the right is 1 – 0.0228 = 0.9772.
If the area to the left of x is 0.012, then what is the area to the right?
1 − 0.012 = 0.988
The final exam scores in a statistics class were normally distributed with a mean of 63 and a standard deviation of five.
a. Find the probability that a randomly selected student scored more than 65 on the exam.
a. Let X = a score on the final exam. X ~ N (63, 5), where μ = 63 and σ = 5
Draw a graph.
Then, find P ( x >65).
P ( x >65) = 0.3446
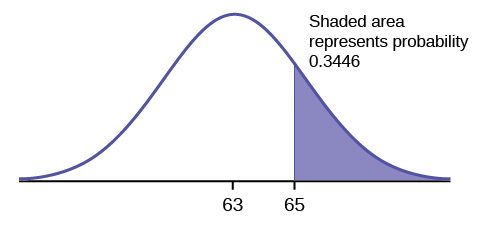
The probability that any student selected at random scores more than 65 is 0.3446.
Go into
2nd DISTR .
After pressing
2nd DISTR , press
2:normalcdf .
The syntax for the instructions are as follows:
normalcdf(lower value, upper value, mean, standard deviation)
For this problem: normalcdf(65,1E99,63,5) = 0.3446. You get 1E99 (= 10
99 ) by pressing
1 , the
EE key (a 2nd key) and then
99 . Or, you can enter
10^99 instead. The number 10
99 is way out in the right tail of the normal curve. We are calculating the area between 65 and 10
99 . In some instances, the lower number of the area might be –1E99 (= –10
99 ). The number –10
99 is way out in the left tail of the normal curve.
The TI probability program calculates a z -score and then the probability from the z -score. Before technology, the z -score was looked up in a standard normal probability table (because the math involved is too cumbersome) to find the probability. In this example, a standard normal table with area to the left of the z -score was used. You calculate the z -score and look up the area to the left. The probability is the area to the right.
z = = 0.4
Area to the left is 0.6554.
P ( x >65) = P ( z >0.4) = 1 – 0.6554 = 0.3446
Calculate the z -score:
*Press
2nd Distr
*Press
3:invNorm (
*Enter the area to the left of z followed by )
*Press
ENTER .
For this Example, the steps are
2nd Distr
3:invNorm (.6554)
ENTER
The answer is 0.3999 which rounds to 0.4.
b. Find the probability that a randomly selected student scored less than 85.
b. Draw a graph.
Then find P ( x <85), and shade the graph.
Using a computer or calculator, find P ( x <85) = 1.
normalcdf(0,85,63,5) = 1 (rounds to one)
The probability that one student scores less than 85 is approximately one (or 100%).
c. Find the 90 th percentile (that is, find the score k that has 90% of the scores below k and 10% of the scores above k ).
c. Find the 90 th percentile. For each problem or part of a problem, draw a new graph. Draw the x -axis. Shade the area that corresponds to the 90 th percentile.
Let k = the 90 th percentile. The variable k is located on the x -axis. P ( x < k ) is the area to the left of k . The 90 th percentile k separates the exam scores into those that are the same or lower than k and those that are the same or higher. Ninety percent of the test scores are the same or lower than k , and ten percent are the same or higher. The variable k is often called a critical value .
k = 69.4
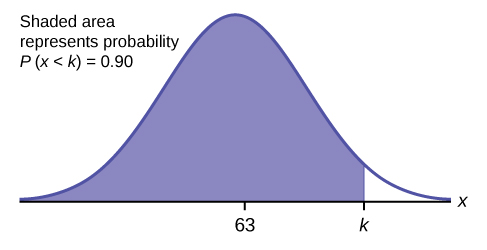
The 90 th percentile is 69.4. This means that 90% of the test scores fall at or below 69.4 and 10% fall at or above. To get this answer on the calculator, follow this step:
Notification Switch
Would you like to follow the 'Introductory statistics' conversation and receive update notifications?

|
|

|
|

|
|

|
|

|
|

|
|

|
|

|
|
|
|
|

|
|

|