

| << Chapter < Page | Chapter >> Page > |
We begin by defining a continuous probability density function. We use the function notation . Intermediate algebra may have been your first formal introduction to functions. In the study of probability, the functions we study are special. We define the function so that the area between it and the x-axis is equal to a probability. Since the maximum probability is one,the maximum area is also one.
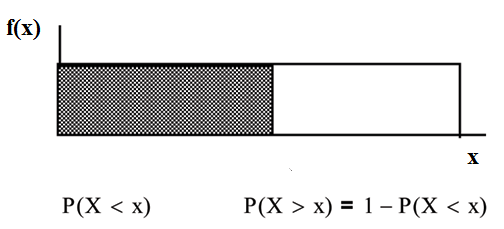
For continuous probability distributions, PROBABILITY = AREA.
Consider the function for . = a real number. The graph of is a horizontal line. However, since , is restricted to the portion between and , inclusive .
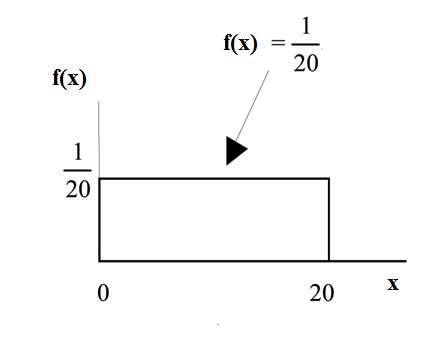
for .
The graph of isa horizontal line segment when .
The area between where and the x-axis is the area of a rectangle with base = and height = .
This particular function, where we have restricted so that the area between the function and the x-axis is 1, is an example of a continuousprobability density function. It is used as a tool to calculate probabilities.
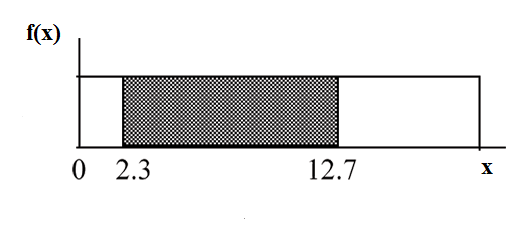
Suppose we want to find the area between and the x-axis where .
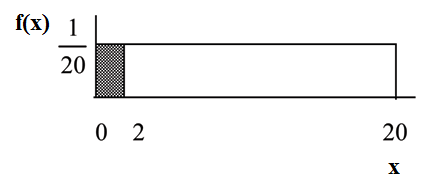
= the height.
The area corresponds to a probability. The probability that is between 0 and 2 is 0.1, which can be written mathematically as .
Suppose we want to find the area between and the x-axis where .
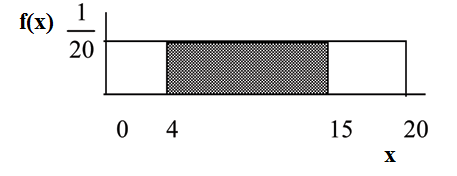
= the height.
The area corresponds to the probability .
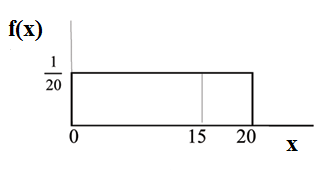
Suppose we want to find . On an x-y graph, is a vertical line. A vertical line has no width (or 0 width). Therefore, .
(can be written as for continuous distributions) is called the cumulative distribution function or . Notice the "less than or equal to" symbol. We can use the to calculate . The gives "area to the left" and gives "area to the right." We calculate for continuous distributions as follows: .
Label the graph with and . Scale the x and y axes with the maximum and values. , .
Notification Switch
Would you like to follow the 'Collaborative statistics' conversation and receive update notifications?

|
|

|
|

|
|

|
|

|
|

|
|

|
|

|
|

|
|

|