<< Chapter < Page Chapter >> Page >

Sometimes, when the probability problems are complex, it can be helpful to graph the situation. Tree diagrams and Venn diagrams are two tools that can be used to visualize and solve conditional probabilities.

Tree diagrams

A tree diagram is a special type of graph used to determine the outcomes of an experiment. It consists of "branches" that are labeled with either frequencies or probabilities. Tree diagrams can make some probability problems easier to visualize and solve. The following example illustrates how to use a tree diagram.

In an urn, there are 11 balls. Three balls are red ( R ) and eight balls are blue ( B ). Draw two balls, one at a time, with replacement . "With replacement" means that you put the first ball back in the urn before you select the second ball. The tree diagram using frequencies that show all the possible outcomes follows.

This is a tree diagram with branches showing frequencies of each draw. The first branch shows two lines: 8B and 3R. The second branch has a set of two lines (8B and 3R) for each line of the first branch. Multiply along each line to find 64BB, 24BR, 24RB, and 9RR.
Total = 64 + 24 + 24 + 9 = 121

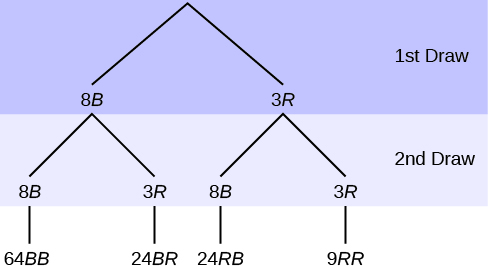
The first set of branches represents the first draw. The second set of branches represents the second draw. Each of the outcomes is distinct. In fact, we can list each red ball as R 1, R 2, and R 3 and each blue ball as B 1, B 2, B 3, B 4, B 5, B 6, B 7, and B 8. Then the nine RR outcomes can be written as:

  • R 1 R 1
  • R 1 R 2
  • R 1 R 3
  • R 2 R 1
  • R 2 R 2
  • R 2 R 3
  • R 3 R 1
  • R 3 R 2
  • R 3 R 3

The other outcomes are similar.

There are a total of 11 balls in the urn. Draw two balls, one at a time, with replacement. There are 11(11) = 121 outcomes, the size of the sample space .

a. List the 24 BR outcomes: B 1 R 1, B 1 R 2, B 1 R 3, ...

a.

  • B 1 R 1
  • B 1 R 2
  • B 1 R 3
  • B 2 R 1
  • B 2 R 2
  • B 2 R 3
  • B 3 R 1
  • B 3 R 2
  • B 3 R 3
  • B 4 R 1
  • B 4 R 2
  • B 4 R 3
  • B 5 R 1
  • B 5 R 2
  • B 5 R 3
  • B 6 R 1
  • B 6 R 2
  • B 6 R 3
  • B 7 R 1
  • B 7 R 2
  • B 7 R 3
  • B 8 R 1
  • B 8 R 2
  • B 8 R 3

Got questions? Get instant answers now!

b. Using the tree diagram, calculate P ( RR ).

b. P ( RR ) = ( 3 11 ) ( 3 11 ) = 9 121

Got questions? Get instant answers now!

c. Using the tree diagram, calculate P ( RB OR BR ).

c. P ( RB OR BR ) = ( 3 11 ) ( 8 11 ) + ( 8 11 ) ( 3 11 ) = 48 121

Got questions? Get instant answers now!

d. Using the tree diagram, calculate P ( R on 1st draw AND B on 2nd draw).

d. P ( R on 1st draw AND B on 2nd draw) = P ( RB ) = ( 3 11 ) ( 8 11 ) = 24 121

Got questions? Get instant answers now!

e. Using the tree diagram, calculate P ( R on 2nd draw GIVEN B on 1st draw).

e. P ( R on 2nd draw GIVEN B on 1st draw) = P ( R on 2nd| B on 1st) = 24 88 = 3 11

This problem is a conditional one. The sample space has been reduced to those outcomes that already have a blue on the first draw. There are 24 + 64 = 88 possible outcomes (24 BR and 64 BB ). Twenty-four of the 88 possible outcomes are BR . 24 88 = 3 11 .

Got questions? Get instant answers now!

f. Using the tree diagram, calculate P ( BB ).

f. P ( BB ) =  64 121

Got questions? Get instant answers now!

g. Using the tree diagram, calculate P ( B on the 2nd draw given R on the first draw).

g. P ( B  on 2nd draw| R  on 1st draw) =  8 11

There are 9 + 24 outcomes that have R on the first draw (9 RR and 24 RB ). The sample space is then 9 + 24 = 33. 24 of the 33 outcomes have B on the second draw. The probability is then 24 33 .

Got questions? Get instant answers now!

Try it

In a standard deck, there are 52 cards. 12 cards are face cards (event F ) and 40 cards are not face cards (event N ). Draw two cards, one at a time, with replacement. All possible outcomes are shown in the tree diagram as frequencies. Using the tree diagram, calculate P ( FF ).

This is a tree diagram with branches showing frequencies of each draw. The first branch shows two lines: 12F and 40N. The second branch has a set of two lines (12F and 40N) for each line of the first branch. Multiply along each line to find 144FF, 480FN, 480NF, and 1,600NN.

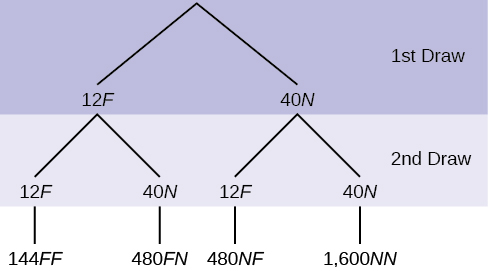
Total number of outcomes is 144 + 480 + 480 + 1600 = 2,704.

P ( FF ) = 144 144 + 480 + 480 + 1,600 = 144 2 , 704 = 9 169

Got questions? Get instant answers now!

An urn has three red marbles and eight blue marbles in it. Draw two marbles, one at a time, this time without replacement, from the urn. "Without replacement" means that you do not put the first ball back before you select the second marble. Following is a tree diagram for this situation. The branches are labeled with probabilities instead of frequencies. The numbers at the ends of the branches are calculated by multiplying the numbers on the two corresponding branches, for example, ( 3 11 ) ( 2 10 ) = 6 110 .

This is a tree diagram with branches showing probabilities of each draw. The first branch shows 2 lines: B 8/11 and R 3/11. The second branch has a set of 2 lines for each first branch line. Below B 8/11 are B 7/10 and R 3/10. Below R 3/11 are B 8/10 and R 2/10. Multiply along each line to find BB 56/110, BR 24/110, RB 24/110, and RR 6/110.
Total = 56 + 24 + 24 + 6 110 = 110 110 = 1

Note

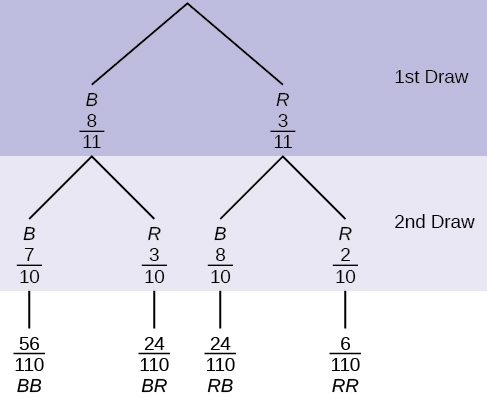
If you draw a red on the first draw from the three red possibilities, there are two red marbles left to draw on the second draw. You do not put back or replace the first marble after you have drawn it. You draw without replacement , so that on the second draw there are ten marbles left in the urn.


Calculate the following probabilities using the tree diagram.

a. P ( RR ) = ________

a. P ( RR ) = ( 3 11 ) ( 2 10 ) = 6 110

Got questions? Get instant answers now!

b. Fill in the blanks:

P ( RB OR BR ) = ( 3 11 ) ( 8 10 )   +  (___)(___)  =   48 110

b. P ( RB OR BR ) = ( 3 11 ) ( 8 10 ) + ( 8 11 ) ( 3 10 ) = 48 110

Got questions? Get instant answers now!

c. P ( R on 2nd| B on 1st) =

c. P ( R on 2nd| B on 1st) = 3 10

Got questions? Get instant answers now!

d. Fill in the blanks.

P ( R on 1st AND B on 2nd) = P ( RB ) = (___)(___) = 24 100

d. P ( R on 1st AND B on 2nd) = P ( RB ) = ( 3 11 ) ( 8 10 ) = 24 100

Got questions? Get instant answers now!

e. Find P ( BB ).

e. P ( BB ) = ( 8 11 ) ( 7 10 )

Got questions? Get instant answers now!

f. Find P ( B on 2nd| R on 1st).

f. Using the tree diagram, P ( B on 2nd| R on 1st) = P ( R | B ) = 8 10 .

Got questions? Get instant answers now!

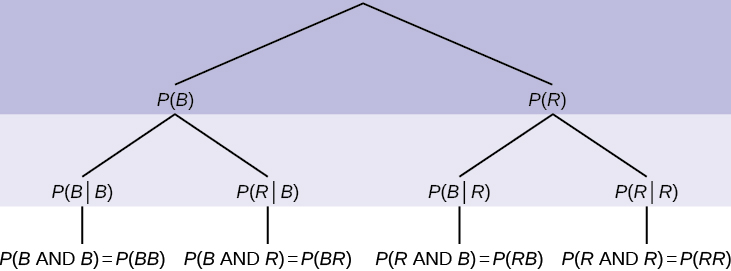
If we are using probabilities, we can label the tree in the following general way.

This is a tree diagram for a two-step experiment. The first branch shows first outcome: P(B) and P(R). The second branch has a set of 2 lines for each line of the first branch: the probability of B given B = P(BB), the probability of R given B = P(RB), the probability of B given R = P(BR), and the probability of R given R = P(RR).
  • P ( R | R ) here means P ( R on 2nd| R on 1st)
  • P ( B | R ) here means P ( B on 2nd| R on 1st)
  • P ( R | B ) here means P ( R on 2nd| B on 1st)
  • P ( B | B ) here means P ( B on 2nd| B on 1st)
Got questions? Get instant answers now!

Questions & Answers

Ayele, K., 2003. Introductory Economics, 3rd ed., Addis Ababa.
Widad Reply
can you send the book attached ?
Ariel
?
Ariel
What is economics
Widad Reply
the study of how humans make choices under conditions of scarcity
AI-Robot
U(x,y) = (x×y)1/2 find mu of x for y
Desalegn Reply
U(x,y) = (x×y)1/2 find mu of x for y
Desalegn
what is ecnomics
Jan Reply
this is the study of how the society manages it's scarce resources
Belonwu
what is macroeconomic
John Reply
macroeconomic is the branch of economics which studies actions, scale, activities and behaviour of the aggregate economy as a whole.
husaini
etc
husaini
difference between firm and industry
husaini Reply
what's the difference between a firm and an industry
Abdul
firm is the unit which transform inputs to output where as industry contain combination of firms with similar production 😅😅
Abdulraufu
Suppose the demand function that a firm faces shifted from Qd  120 3P to Qd  90  3P and the supply function has shifted from QS  20  2P to QS 10  2P . a) Find the effect of this change on price and quantity. b) Which of the changes in demand and supply is higher?
Toofiq Reply
explain standard reason why economic is a science
innocent Reply
factors influencing supply
Petrus Reply
what is economic.
Milan Reply
scares means__________________ends resources. unlimited
Jan
economics is a science that studies human behaviour as a relationship b/w ends and scares means which have alternative uses
Jan
calculate the profit maximizing for demand and supply
Zarshad Reply
Why qualify 28 supplies
Milan
what are explicit costs
Nomsa Reply
out-of-pocket costs for a firm, for example, payments for wages and salaries, rent, or materials
AI-Robot
concepts of supply in microeconomics
David Reply
economic overview notes
Amahle Reply
identify a demand and a supply curve
Salome Reply
i don't know
Parul
there's a difference
Aryan
Demand curve shows that how supply and others conditions affect on demand of a particular thing and what percent demand increase whith increase of supply of goods
Israr
Hi Sir please how do u calculate Cross elastic demand and income elastic demand?
Abari
Got questions? Join the online conversation and get instant answers!
Jobilize.com Reply

Get Jobilize Job Search Mobile App in your pocket Now!

Get it on Google Play Download on the App Store Now


Source:  OpenStax, Introductory statistics. OpenStax CNX. May 06, 2016 Download for free at http://legacy.cnx.org/content/col11562/1.18
Google Play and the Google Play logo are trademarks of Google Inc.

Notification Switch

Would you like to follow the 'Introductory statistics' conversation and receive update notifications?

Ask