<< Chapter < Page Chapter >> Page >

Consider the following data set:

  • 4
  • 5
  • 6
  • 6
  • 6
  • 7
  • 7
  • 7
  • 7
  • 7
  • 7
  • 8
  • 8
  • 8
  • 9
  • 10

This data set produces the histogram shown below. Each interval has width one and each value is located in the middle of an interval.

A histogram with a symmetrical data distribution, with a mean, median, and mode of 7.

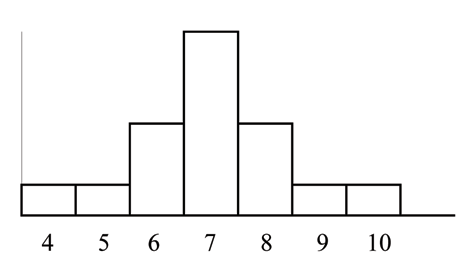
The histogram displays a symmetrical distribution of data. A distribution is symmetrical if a vertical line can be drawn at some point in the histogram such that the shape to the left and the right of the vertical line are mirror images of each other. The mean, the median, and the mode are each 7 for these data. In a perfectly symmetrical distribution, the mean and the median are the same. This example has one mode (unimodal) and the mode is the same as the mean and median. In a symmetrical distribution that has two modes (bimodal), the two modes would be different from the mean and median.

The histogram for the data:

  • 4
  • 5
  • 6
  • 6
  • 6
  • 7
  • 7
  • 7
  • 7
  • 8

is not symmetrical. The right-hand side seems "chopped off" compared to the left side. The shape distribution is called skewed to the left because it is pulled out to the left.

A histogram that is skewed to the left.  The mode is still 7, but the mean and median are less than 7.

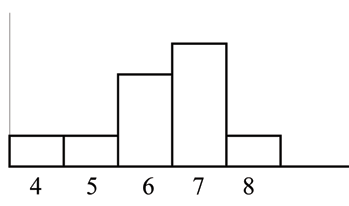
The mean is 6.3, the median is 6.5, and the mode is 7. Notice that the mean is less than the median and they are both less than the mode. The mean and the median both reflect the skewing but the mean more so.

The histogram for the data:

  • 6
  • 7
  • 7
  • 7
  • 7
  • 8
  • 8
  • 8
  • 9
  • 10

is also not symmetrical. It is skewed to the right .

A histogram skewed to the right.  The mode is still 7, but the mean and median are both greater than 7.

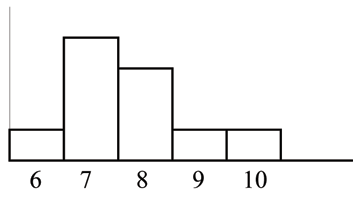
The mean is 7.7, the median is 7.5, and the mode is 7. Of the three statistics, the mean is the largest, while the mode is the smallest . Again, the mean reflects the skewing the most.

To summarize, generally if the distribution of data is skewed to the left, the mean is less than the median, which is often less than the mode. If the distribution of data is skewed to the right, the mode is often less than the median, which is less than the mean.

Skewness and symmetry become important when we discuss probability distributions in later chapters.

Questions & Answers

Ayele, K., 2003. Introductory Economics, 3rd ed., Addis Ababa.
Widad Reply
can you send the book attached ?
Ariel
?
Ariel
What is economics
Widad Reply
the study of how humans make choices under conditions of scarcity
AI-Robot
U(x,y) = (x×y)1/2 find mu of x for y
Desalegn Reply
U(x,y) = (x×y)1/2 find mu of x for y
Desalegn
what is ecnomics
Jan Reply
this is the study of how the society manages it's scarce resources
Belonwu
what is macroeconomic
John Reply
macroeconomic is the branch of economics which studies actions, scale, activities and behaviour of the aggregate economy as a whole.
husaini
etc
husaini
difference between firm and industry
husaini Reply
what's the difference between a firm and an industry
Abdul
firm is the unit which transform inputs to output where as industry contain combination of firms with similar production 😅😅
Abdulraufu
Suppose the demand function that a firm faces shifted from Qd  120 3P to Qd  90  3P and the supply function has shifted from QS  20  2P to QS 10  2P . a) Find the effect of this change on price and quantity. b) Which of the changes in demand and supply is higher?
Toofiq Reply
explain standard reason why economic is a science
innocent Reply
factors influencing supply
Petrus Reply
what is economic.
Milan Reply
scares means__________________ends resources. unlimited
Jan
economics is a science that studies human behaviour as a relationship b/w ends and scares means which have alternative uses
Jan
calculate the profit maximizing for demand and supply
Zarshad Reply
Why qualify 28 supplies
Milan
what are explicit costs
Nomsa Reply
out-of-pocket costs for a firm, for example, payments for wages and salaries, rent, or materials
AI-Robot
concepts of supply in microeconomics
David Reply
economic overview notes
Amahle Reply
identify a demand and a supply curve
Salome Reply
i don't know
Parul
there's a difference
Aryan
Demand curve shows that how supply and others conditions affect on demand of a particular thing and what percent demand increase whith increase of supply of goods
Israr
Hi Sir please how do u calculate Cross elastic demand and income elastic demand?
Abari
Got questions? Join the online conversation and get instant answers!
Jobilize.com Reply

Get Jobilize Job Search Mobile App in your pocket Now!

Get it on Google Play Download on the App Store Now


Source:  OpenStax, Collaborative statistics-parzen remix. OpenStax CNX. Jul 15, 2009 Download for free at http://legacy.cnx.org/content/col10732/1.2
Google Play and the Google Play logo are trademarks of Google Inc.

Notification Switch

Would you like to follow the 'Collaborative statistics-parzen remix' conversation and receive update notifications?

Ask