<< Chapter < Page Chapter >> Page >
This module states the factors associated with F Distributions and provides students with some examples to help further understand the concept. Students will be given the opportunity to see F Distributions in action through participation in an optional classroom exercise.
  1. The curve is not symmetrical but skewed to the right.
  2. There is a different curve for each set of dfs .
  3. The F statistic is greater than or equal to zero.
  4. As the degrees of freedom for the numerator and for the denominator get larger, the curve approximates the normal.
  5. Other uses for the F distribution include comparing two variances and Two-Way Analysis of Variance. Comparing two variances is discussed at the end of the chapter.Two-Way Analysis is mentioned for your information only.

Nonsymmetrical F distribution curve skewed to the right, more values in the right tail and the peak is closer to the left. This curve is different from the graph on the right because of the different dfs. Nonsymmetrical F distribution curve skewed to the right, more values in the right tail and the peak is closer to the left. This curve is different from the graph on the left because of the different dfs. Because its dfs are larger, it is closer in resemblance to a normal distribution curve.

One-Way ANOVA: Four sororities took a random sample of sisters regarding their grade means for the past term. The results are shown below:

MEAN GRADES FOR FOUR SORORITIES
Sorority 1 Sorority 2 Sorority 3 Sorority 4
2.17 2.63 2.63 3.79
1.85 1.77 3.78 3.45
2.83 3.25 4.00 3.08
1.69 1.86 2.55 2.26
3.33 2.21 2.45 3.18

Using a significance level of 1%, is there a difference in mean grades among the sororities?

Let μ 1 , μ 2 , μ 3 , μ 4 be the population means of the sororities. Remember that the null hypothesis claims that the sorority groups are from the same normal distribution.The alternate hypothesis says that at least two of the sorority groups come from populations with different normal distributions. Notice that the four sample sizes areeach size 5.

This is an example of a balanced design , since each factor (i.e. Sorority) has the same number of observations.

H o : μ 1 = μ 2 = μ 3 = μ 4

H a : Not all of the means μ 1 , μ 2 , μ 3 , μ 4 are equal.

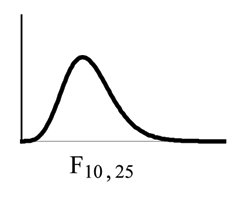
Distribution for the test: F 3 , 16

where k = 4 groups and n = 20 samples in total

df(num) = k - 1 = 4 - 1 = 3

df(denom) = n - k = 20 - 4 = 16

Calculate the test statistic: F = 2.23

Graph:

Nonsymmetrical F distribution curve with values of 0 and 2.23 on the x-axis representing the test statistic of sorority grade averages. A vertical upward line extends from 2.23 to the curve and the area to the right of this is equal to the p-value.

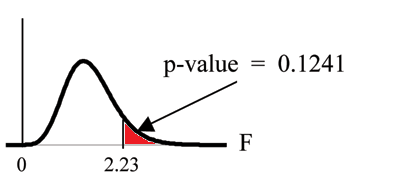
Probability statement: p-value = P ( F > 2.23 ) = 0.1241

Compare α and the p-value : α = 0.01 p-value = 0.1241 α < p-value

Make a decision: Since α < p-value , you cannot reject H o .

Conclusion: There is not sufficient evidence to conclude that there is a difference among the mean grades for the sororities.

TI-83+ or TI 84: Put the data into lists L1, L2, L3, and L4. Press STAT and arrow over to TESTS . Arrow down to F:ANOVA . Press ENTER and Enter ( L1,L2,L3,L4 ). The F statistic is 2.2303 and the p-value is 0.1241. df(numerator) = 3 (under "Factor" ) and df(denominator) = 16 (under Error ).

Got questions? Get instant answers now!

A fourth grade class is studying the environment. One of the assignments is to grow bean plants in different soils. Tommy chose to grow his beanplants in soil found outside his classroom mixed with dryer lint. Tara chose to grow her bean plants in potting soil bought at the local nursery. Nick chose to grow his beanplants in soil from his mother's garden. No chemicals were used on the plants, only water. They were grown inside the classroom next to a large window. Each childgrew 5 plants. At the end of the growing period, each plant was measured, producing the following data (in inches):

Tommy's Plants Tara's Plants Nick's Plants
24 25 23
21 31 27
23 23 22
30 20 30
23 28 20

Does it appear that the three media in which the bean plants were grown produce the same mean height? Test at a 3% level of significance.

This time, we will perform the calculations that lead to the F' statistic. Notice that each group has the same number of plants so we will use the formula F' = n s x _ 2 s 2 pooled .

First, calculate the sample mean and sample variance of each group.

Tommy's Plants Tara's Plants Nick's Plants
Sample Mean 24.2 25.4 24.4
Sample Variance 11.7 18.3 16.3

Next, calculate the variance of the three group means (Calculate the variance of 24.2, 25.4, and 24.4). Variance of the group means = 0.413 = s x 2

Then MS between = n s x 2 = ( 5 ) ( 0.413 ) where n = 5 is the sample size (number of plants each child grew).

Calculate the mean of the three sample variances (Calculate the mean of 11.7, 18.3, and 16.3). Mean of the sample variances = 15.433 = s 2 pooled size 12{ \( s rSub { size 8{ ital "pooled"} } \) rSup { size 8{2} } ={}} {}

Then MS within = s 2 pooled size 12{ \( s rSub { size 8{ ital "pooled"} } \) rSup { size 8{2} } ={}} {} = 15.433 .

The F statistic (or F ratio) is F = MS between MS within = n s x _ 2 s 2 pooled = ( 5 ) ( 0.413 ) 15.433 = 0.134

The dfs for the numerator = the number of groups - 1 = 3 - 1 = 2

The dfs for the denominator = the total number of samples - the number of groups = 15 - 3 = 12

The distribution for the test is F 2 , 12 and the F statistic is F = 0.134

The p-value is P ( F > 0.134 ) = 0.8759 .

Decision: Since α = 0.03 and the p-value = 0.8759 , do not reject H o . (Why?)

Conclusion: With a 3% the level of significance, from the sample data, the evidence is not sufficient to conclude that the mean heights of the bean plants are different.

(This experiment was actually done by three classmates of the son of one of the authors.)

Got questions? Get instant answers now!

Another fourth grader also grew bean plants but this time in a jelly-like mass. The heights were (in inches) 24, 28, 25, 30, and 32.

Do a One-Way ANOVA test on the 4 groups. You may use your calculator or computer to perform the test. Are the heights of the bean plants different? Use a solution sheet .

  • F = 0.9496
  • p-value = 0.4402

From the sample data, the evidence is not sufficient to conclude that the mean heights of the bean plants are different.

Got questions? Get instant answers now!

Optional classroom activity

From the class, create four groups of the same size as follows: men under 22, men at least 22, women under 22, women at least 22. Have each member of each group record the number of states in the United States he or she has visited.Run an ANOVA test to determine if the average number of states visited in the four groups are the same. Test at a 1% level of significance. Use one of the solution sheets at the end of the chapter (after the homework).

Questions & Answers

it is the relatively stable flow of income
Chidubem Reply
what is circular flow of income
Divine Reply
branches of macroeconomics
SHEDRACK Reply
what is Flexible exchang rate?
poudel Reply
is gdp a reliable measurement of wealth
Atega Reply
introduction to econometrics
Husseini Reply
Hi
mostafa
hi
LEMLEM
hello
Sammol
hi
Mahesh
bi
Ruqayat
hi
Ruqayat
Hi fellas
Nyawa
hey
Sammol
hi
God
hello
Jahara
Good morning
Jorge
hi
abubakar
hi
Nmesoma
hi
Mahesh
Hi
Tom
Why is unemployment rate never zero at full employment?
Priyanka Reply
bcoz of existence of frictional unemployment in our economy.
Umashankar
what is flexible exchang rate?
poudel
due to existence of the pple with disabilities
Abdulraufu
the demand of a good rises, causing the demand for another good to fall
Rushawn Reply
is it possible to leave every good at the same level
Joseph
I don't think so. because check it, if the demand for chicken increases, people will no longer consume fish like they used to causing a fall in the demand for fish
Anuolu
is not really possible to let the value of a goods to be same at the same time.....
Salome
Suppose the inflation rate is 6%, does it mean that all the goods you purchase will cost 6% more than previous year? Provide with reasoning.
Geetha Reply
Not necessarily. To measure the inflation rate economists normally use an averaged price index of a basket of certain goods. So if you purchase goods included in the basket, you will notice that you pay 6% more, otherwise not necessarily.
Waeth
discus major problems of macroeconomics
Alii Reply
what is the problem of macroeconomics
Yoal
Economic growth Stable prices and low unemployment
Ephraim
explain inflationcause and itis degre
Miresa Reply
what is inflation
Getu
increase in general price levels
WEETO
Good day How do I calculate this question: C= 100+5yd G= 2000 T= 2000 I(planned)=200. Suppose the actual output is 3000. What is the level of planned expenditures at this level of output?
Chisomo Reply
how to calculate actual output?
Chisomo
how to calculate the equilibrium income
Beshir
Criteria for determining money supply
Thapase Reply
who we can define macroeconomics in one line
Muhammad
Aggregate demand
Mohammed
C=k100 +9y and i=k50.calculate the equilibrium level of output
Mercy Reply
Hi
Isiaka
Hi
Geli
hy
Man
👋
Bahunda
hy how are you?
Man
ys
Amisha
how are you guys
Sekou
f9 guys
Amisha
how are you guys
Sekou
ys am also fine
Amisha
fine and you guys
Geli
from Nepal
Amisha
nawalparasi district from belatari
Amisha
nd u
Amisha
I am Camara from Guinea west Africa... happy to meet you guys here
Sekou
ma management ho
Amisha
ahile becheclor ho
Amisha
hjr ktm bta ho ani k kaam grnu hunxa tw
Amisha
belatari
Amisha
1st year ho
Amisha
nd u
Amisha
ahh
Amisha
kaha biratnagar
Amisha
ys
Amisha
kina k vo
Amisha
money as unit of account means what?
Kalombe
A unit of account is something that can be used to value goods and services and make calculations
Jim
all of you please speak in English I can't understand you're language
Muhammad
I want to know how can we define macroeconomics in one line
Muhammad
it must be .9 or 0.9 no Mpc is greater than 1 Y=100+.9Y+50 Y-.9Y=150 0.1Y/0.1=150/0.1 Y=1500
Kalombe
Mercy is it clear?😋
Kalombe
hi can someone help me on this question If a negative shocks shifts the IS curve to the left, what type of policy do you suggest so as to stabilize the level of output? discuss your answer using appropriate graph.
Galge Reply
if interest rate is increased this will will reduce the level of income shifting the curve to the left ◀️
Kalombe
Got questions? Join the online conversation and get instant answers!
Jobilize.com Reply

Get Jobilize Job Search Mobile App in your pocket Now!

Get it on Google Play Download on the App Store Now


Source:  OpenStax, Collaborative statistics. OpenStax CNX. Jul 03, 2012 Download for free at http://cnx.org/content/col10522/1.40
Google Play and the Google Play logo are trademarks of Google Inc.

Notification Switch

Would you like to follow the 'Collaborative statistics' conversation and receive update notifications?

Ask