<< Chapter < Page Chapter >> Page >
This module states the factors associated with F Distributions and provides students with some examples to help further understand the concept. Students will be given the opportunity to see F Distributions in action through participation in an optional classroom exercise.
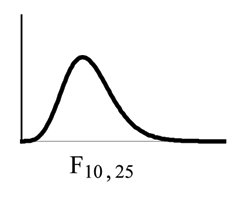
  1. The curve is not symmetrical but skewed to the right.
  2. There is a different curve for each set of dfs .
  3. The F statistic is greater than or equal to zero.
  4. As the degrees of freedom for the numerator and for the denominator get larger, the curve approximates the normal.
  5. Other uses for the F distribution include comparing two variances and Two-Way Analysis of Variance. Comparing two variances is discussed at the end of the chapter.Two-Way Analysis is mentioned for your information only.

Nonsymmetrical F distribution curve skewed to the right, more values in the right tail and the peak is closer to the left. This curve is different from the graph on the right because of the different dfs. Nonsymmetrical F distribution curve skewed to the right, more values in the right tail and the peak is closer to the left. This curve is different from the graph on the left because of the different dfs. Because its dfs are larger, it is closer in resemblance to a normal distribution curve.

One-Way ANOVA: Four sororities took a random sample of sisters regarding their grade means for the past term. The results are shown below:

MEAN GRADES FOR FOUR SORORITIES
Sorority 1 Sorority 2 Sorority 3 Sorority 4
2.17 2.63 2.63 3.79
1.85 1.77 3.78 3.45
2.83 3.25 4.00 3.08
1.69 1.86 2.55 2.26
3.33 2.21 2.45 3.18

Using a significance level of 1%, is there a difference in mean grades among the sororities?

Let μ 1 , μ 2 , μ 3 , μ 4 be the population means of the sororities. Remember that the null hypothesis claims that the sorority groups are from the same normal distribution.The alternate hypothesis says that at least two of the sorority groups come from populations with different normal distributions. Notice that the four sample sizes areeach size 5.

This is an example of a balanced design , since each factor (i.e. Sorority) has the same number of observations.

H o : μ 1 = μ 2 = μ 3 = μ 4

H a : Not all of the means μ 1 , μ 2 , μ 3 , μ 4 are equal.

Distribution for the test: F 3 , 16

where k = 4 groups and n = 20 samples in total

df(num) = k - 1 = 4 - 1 = 3

df(denom) = n - k = 20 - 4 = 16

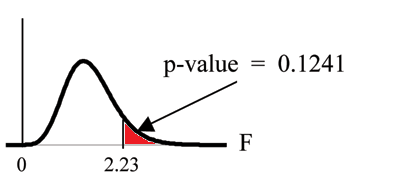
Calculate the test statistic: F = 2.23

Graph:

Nonsymmetrical F distribution curve with values of 0 and 2.23 on the x-axis representing the test statistic of sorority grade averages. A vertical upward line extends from 2.23 to the curve and the area to the right of this is equal to the p-value.

Probability statement: p-value = P ( F > 2.23 ) = 0.1241

Compare α and the p-value : α = 0.01 p-value = 0.1241 α < p-value

Make a decision: Since α < p-value , you cannot reject H o .

Conclusion: There is not sufficient evidence to conclude that there is a difference among the mean grades for the sororities.

TI-83+ or TI 84: Put the data into lists L1, L2, L3, and L4. Press STAT and arrow over to TESTS . Arrow down to F:ANOVA . Press ENTER and Enter ( L1,L2,L3,L4 ). The F statistic is 2.2303 and the p-value is 0.1241. df(numerator) = 3 (under "Factor" ) and df(denominator) = 16 (under Error ).

Got questions? Get instant answers now!

A fourth grade class is studying the environment. One of the assignments is to grow bean plants in different soils. Tommy chose to grow his beanplants in soil found outside his classroom mixed with dryer lint. Tara chose to grow her bean plants in potting soil bought at the local nursery. Nick chose to grow his beanplants in soil from his mother's garden. No chemicals were used on the plants, only water. They were grown inside the classroom next to a large window. Each childgrew 5 plants. At the end of the growing period, each plant was measured, producing the following data (in inches):

Tommy's Plants Tara's Plants Nick's Plants
24 25 23
21 31 27
23 23 22
30 20 30
23 28 20

Does it appear that the three media in which the bean plants were grown produce the same mean height? Test at a 3% level of significance.

This time, we will perform the calculations that lead to the F' statistic. Notice that each group has the same number of plants so we will use the formula F' = n s x _ 2 s 2 pooled .

First, calculate the sample mean and sample variance of each group.

Tommy's Plants Tara's Plants Nick's Plants
Sample Mean 24.2 25.4 24.4
Sample Variance 11.7 18.3 16.3

Next, calculate the variance of the three group means (Calculate the variance of 24.2, 25.4, and 24.4). Variance of the group means = 0.413 = s x 2

Then MS between = n s x 2 = ( 5 ) ( 0.413 ) where n = 5 is the sample size (number of plants each child grew).

Calculate the mean of the three sample variances (Calculate the mean of 11.7, 18.3, and 16.3). Mean of the sample variances = 15.433 = s 2 pooled size 12{ \( s rSub { size 8{ ital "pooled"} } \) rSup { size 8{2} } ={}} {}

Then MS within = s 2 pooled size 12{ \( s rSub { size 8{ ital "pooled"} } \) rSup { size 8{2} } ={}} {} = 15.433 .

The F statistic (or F ratio) is F = MS between MS within = n s x _ 2 s 2 pooled = ( 5 ) ( 0.413 ) 15.433 = 0.134

The dfs for the numerator = the number of groups - 1 = 3 - 1 = 2

The dfs for the denominator = the total number of samples - the number of groups = 15 - 3 = 12

The distribution for the test is F 2 , 12 and the F statistic is F = 0.134

The p-value is P ( F > 0.134 ) = 0.8759 .

Decision: Since α = 0.03 and the p-value = 0.8759 , do not reject H o . (Why?)

Conclusion: With a 3% the level of significance, from the sample data, the evidence is not sufficient to conclude that the mean heights of the bean plants are different.

(This experiment was actually done by three classmates of the son of one of the authors.)

Got questions? Get instant answers now!

Another fourth grader also grew bean plants but this time in a jelly-like mass. The heights were (in inches) 24, 28, 25, 30, and 32.

Do a One-Way ANOVA test on the 4 groups. You may use your calculator or computer to perform the test. Are the heights of the bean plants different? Use a solution sheet .

  • F = 0.9496
  • p-value = 0.4402

From the sample data, the evidence is not sufficient to conclude that the mean heights of the bean plants are different.

Got questions? Get instant answers now!

Optional classroom activity

From the class, create four groups of the same size as follows: men under 22, men at least 22, women under 22, women at least 22. Have each member of each group record the number of states in the United States he or she has visited.Run an ANOVA test to determine if the average number of states visited in the four groups are the same. Test at a 1% level of significance. Use one of the solution sheets at the end of the chapter (after the homework).

Questions & Answers

what does preconceived mean
sammie Reply
physiological Psychology
Nwosu Reply
How can I develope my cognitive domain
Amanyire Reply
why is communication effective
Dakolo Reply
Communication is effective because it allows individuals to share ideas, thoughts, and information with others.
effective communication can lead to improved outcomes in various settings, including personal relationships, business environments, and educational settings. By communicating effectively, individuals can negotiate effectively, solve problems collaboratively, and work towards common goals.
it starts up serve and return practice/assessments.it helps find voice talking therapy also assessments through relaxed conversation.
miss
Every time someone flushes a toilet in the apartment building, the person begins to jumb back automatically after hearing the flush, before the water temperature changes. Identify the types of learning, if it is classical conditioning identify the NS, UCS, CS and CR. If it is operant conditioning, identify the type of consequence positive reinforcement, negative reinforcement or punishment
Wekolamo Reply
please i need answer
Wekolamo
because it helps many people around the world to understand how to interact with other people and understand them well, for example at work (job).
Manix Reply
Agreed 👍 There are many parts of our brains and behaviors, we really need to get to know. Blessings for everyone and happy Sunday!
ARC
A child is a member of community not society elucidate ?
JESSY Reply
Isn't practices worldwide, be it psychology, be it science. isn't much just a false belief of control over something the mind cannot truly comprehend?
Simon Reply
compare and contrast skinner's perspective on personality development on freud
namakula Reply
Skinner skipped the whole unconscious phenomenon and rather emphasized on classical conditioning
war
explain how nature and nurture affect the development and later the productivity of an individual.
Amesalu Reply
nature is an hereditary factor while nurture is an environmental factor which constitute an individual personality. so if an individual's parent has a deviant behavior and was also brought up in an deviant environment, observation of the behavior and the inborn trait we make the individual deviant.
Samuel
I am taking this course because I am hoping that I could somehow learn more about my chosen field of interest and due to the fact that being a PsyD really ignites my passion as an individual the more I hope to learn about developing and literally explore the complexity of my critical thinking skills
Zyryn Reply
good👍
Jonathan
and having a good philosophy of the world is like a sandwich and a peanut butter 👍
Jonathan
generally amnesi how long yrs memory loss
Kelu Reply
interpersonal relationships
Abdulfatai Reply
What would be the best educational aid(s) for gifted kids/savants?
Heidi Reply
treat them normal, if they want help then give them. that will make everyone happy
Saurabh
What are the treatment for autism?
Magret Reply
hello. autism is a umbrella term. autistic kids have different disorder overlapping. for example. a kid may show symptoms of ADHD and also learning disabilities. before treatment please make sure the kid doesn't have physical disabilities like hearing..vision..speech problem. sometimes these
Jharna
continue.. sometimes due to these physical problems..the diagnosis may be misdiagnosed. treatment for autism. well it depends on the severity. since autistic kids have problems in communicating and adopting to the environment.. it's best to expose the child in situations where the child
Jharna
child interact with other kids under doc supervision. play therapy. speech therapy. Engaging in different activities that activate most parts of the brain.. like drawing..painting. matching color board game. string and beads game. the more you interact with the child the more effective
Jharna
results you'll get.. please consult a therapist to know what suits best on your child. and last as a parent. I know sometimes it's overwhelming to guide a special kid. but trust the process and be strong and patient as a parent.
Jharna
Got questions? Join the online conversation and get instant answers!
Jobilize.com Reply

Get Jobilize Job Search Mobile App in your pocket Now!

Get it on Google Play Download on the App Store Now


Source:  OpenStax, Collaborative statistics. OpenStax CNX. Jul 03, 2012 Download for free at http://cnx.org/content/col10522/1.40
Google Play and the Google Play logo are trademarks of Google Inc.

Notification Switch

Would you like to follow the 'Collaborative statistics' conversation and receive update notifications?

Ask