<< Chapter < Page Chapter >> Page >

In some data sets, there are values (observed data points) called outliers . Outliers are observed data points that are far from the least squares line. They have large "errors", where the "error" or residual is the vertical distance from the line to the point.

Outliers need to be examined closely. Sometimes, for some reason or another, they should not be included in the analysis of the data. It is possible that an outlier is a result of erroneous data. Other times, an outlier may hold valuable information about the population under study and should remain included in the data. The key is to examine carefully what causes a data point to be an outlier.

Besides outliers, a sample may contain one or a few points that are called influential points . Influential points are observed data points that are far from the other observed data points in the horizontal direction. These points may have a big effect on the slope of the regression line. To begin to identify an influential point, you can remove it from the data set and see if the slope of the regression line is changed significantly.

Computers and many calculators can be used to identify outliers from the data. Computer output for regression analysis will often identify both outliers and influential points so that you can examine them.

Identifying outliers

We could guess at outliers by looking at a graph of the scatterplot and best fit-line. However, we would like some guideline as to how far away a point needs to be in order to be considered an outlier. As a rough rule of thumb, we can flag any point that is located further than two standard deviations above or below the best-fit line as an outlier . The standard deviation used is the standard deviation of the residuals or errors.

We can do this visually in the scatter plot by drawing an extra pair of lines that are two standard deviations above and below the best-fit line. Any data points that are outside this extra pair of lines are flagged as potential outliers. Or we can do this numerically by calculating each residual and comparing it to twice the standard deviation. On the TI-83, 83+, or 84+, the graphical approach is easier. The graphical procedure is shown first, followed by the numerical calculations. You would generally need to use only one of these methods.

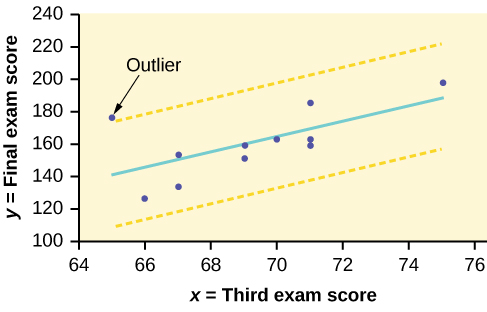
In the third exam/final exam example , you can determine if there is an outlier or not. If there is an outlier, as an exercise, delete it and fit the remaining data to a new line. For this example, the new line ought to fit the remaining data better. This means the SSE should be smaller and the correlation coefficient ought to be closer to 1 or –1.

Graphical identification of outliers

With the TI-83, 83+, 84+ graphing calculators, it is easy to identify the outliers graphically and visually. If we were to measure the vertical distance from any data point to the corresponding point on the line of best fit and that distance were equal to 2 s or more, then we would consider the data point to be "too far" from the line of best fit. We need to find and graph the lines that are two standard deviations below and above the regression line. Any points that are outside these two lines are outliers. We will call these lines Y2 and Y3:

As we did with the equation of the regression line and the correlation coefficient, we will use technology to calculate this standard deviation for us. Using the LinRegTTest with this data, scroll down through the output screens to find s = 16.412 .

Line Y2 = –173.5 + 4.83 x –2(16.4) and line Y3 = –173.5 + 4.83 x + 2(16.4)

where ŷ = –173.5 + 4.83 x is the line of best fit. Y2 and Y3 have the same slope as the line of best fit.

Graph the scatterplot with the best fit line in equation Y1, then enter the two extra lines as Y2 and Y3 in the "Y="equation editor and press ZOOM 9. You will find that the only data point that is not between lines Y2 and Y3 is the point x = 65, y = 175. On the calculator screen it is just barely outside these lines. The outlier is the student who had a grade of 65 on the third exam and 175 on the final exam; this point is further than two standard deviations away from the best-fit line.

Sometimes a point is so close to the lines used to flag outliers on the graph that it is difficult to tell if the point is between or outside the lines. On a computer, enlarging the graph may help; on a small calculator screen, zooming in may make the graph clearer. Note that when the graph does not give a clear enough picture, you can use the numerical comparisons to identify outliers.

The scatter plot of exam scores with a line of best fit.Two yellow dashed lines run parallel to the line of best fit. The dashed lines run above and below the best fit line at equal distances. One data point falls outside the boundary created by the dashed lines—it is an outlier.
Got questions? Get instant answers now!

Questions & Answers

Three charges q_{1}=+3\mu C, q_{2}=+6\mu C and q_{3}=+8\mu C are located at (2,0)m (0,0)m and (0,3) coordinates respectively. Find the magnitude and direction acted upon q_{2} by the two other charges.Draw the correct graphical illustration of the problem above showing the direction of all forces.
Kate Reply
To solve this problem, we need to first find the net force acting on charge q_{2}. The magnitude of the force exerted by q_{1} on q_{2} is given by F=\frac{kq_{1}q_{2}}{r^{2}} where k is the Coulomb constant, q_{1} and q_{2} are the charges of the particles, and r is the distance between them.
Muhammed
What is the direction and net electric force on q_{1}= 5µC located at (0,4)r due to charges q_{2}=7mu located at (0,0)m and q_{3}=3\mu C located at (4,0)m?
Kate Reply
what is the change in momentum of a body?
Eunice Reply
what is a capacitor?
Raymond Reply
Capacitor is a separation of opposite charges using an insulator of very small dimension between them. Capacitor is used for allowing an AC (alternating current) to pass while a DC (direct current) is blocked.
Gautam
A motor travelling at 72km/m on sighting a stop sign applying the breaks such that under constant deaccelerate in the meters of 50 metres what is the magnitude of the accelerate
Maria Reply
please solve
Sharon
8m/s²
Aishat
What is Thermodynamics
Muordit
velocity can be 72 km/h in question. 72 km/h=20 m/s, v^2=2.a.x , 20^2=2.a.50, a=4 m/s^2.
Mehmet
A boat travels due east at a speed of 40meter per seconds across a river flowing due south at 30meter per seconds. what is the resultant speed of the boat
Saheed Reply
50 m/s due south east
Someone
which has a higher temperature, 1cup of boiling water or 1teapot of boiling water which can transfer more heat 1cup of boiling water or 1 teapot of boiling water explain your . answer
Ramon Reply
I believe temperature being an intensive property does not change for any amount of boiling water whereas heat being an extensive property changes with amount/size of the system.
Someone
Scratch that
Someone
temperature for any amount of water to boil at ntp is 100⁰C (it is a state function and and intensive property) and it depends both will give same amount of heat because the surface available for heat transfer is greater in case of the kettle as well as the heat stored in it but if you talk.....
Someone
about the amount of heat stored in the system then in that case since the mass of water in the kettle is greater so more energy is required to raise the temperature b/c more molecules of water are present in the kettle
Someone
definitely of physics
Haryormhidey Reply
how many start and codon
Esrael Reply
what is field
Felix Reply
physics, biology and chemistry this is my Field
ALIYU
field is a region of space under the influence of some physical properties
Collete
what is ogarnic chemistry
WISDOM Reply
determine the slope giving that 3y+ 2x-14=0
WISDOM
Another formula for Acceleration
Belty Reply
a=v/t. a=f/m a
IHUMA
innocent
Adah
pratica A on solution of hydro chloric acid,B is a solution containing 0.5000 mole ofsodium chlorid per dm³,put A in the burret and titrate 20.00 or 25.00cm³ portion of B using melting orange as the indicator. record the deside of your burret tabulate the burret reading and calculate the average volume of acid used?
Nassze Reply
how do lnternal energy measures
Esrael
Two bodies attract each other electrically. Do they both have to be charged? Answer the same question if the bodies repel one another.
JALLAH Reply
No. According to Isac Newtons law. this two bodies maybe you and the wall beside you. Attracting depends on the mass och each body and distance between them.
Dlovan
Are you really asking if two bodies have to be charged to be influenced by Coulombs Law?
Robert
like charges repel while unlike charges atttact
Raymond
What is specific heat capacity
Destiny Reply
Specific heat capacity is a measure of the amount of energy required to raise the temperature of a substance by one degree Celsius (or Kelvin). It is measured in Joules per kilogram per degree Celsius (J/kg°C).
AI-Robot
specific heat capacity is the amount of energy needed to raise the temperature of a substance by one degree Celsius or kelvin
ROKEEB
Got questions? Join the online conversation and get instant answers!
Jobilize.com Reply

Get Jobilize Job Search Mobile App in your pocket Now!

Get it on Google Play Download on the App Store Now


Source:  OpenStax, Introductory statistics. OpenStax CNX. May 06, 2016 Download for free at http://legacy.cnx.org/content/col11562/1.18
Google Play and the Google Play logo are trademarks of Google Inc.

Notification Switch

Would you like to follow the 'Introductory statistics' conversation and receive update notifications?

Ask