

| << Chapter < Page | Chapter >> Page > |
A test of a single variance assumes that the underlying distribution is normal . The null and alternative hypotheses are stated in terms of the population variance (or population standard deviation). The test statistic is:
where:
You may think of s as the random variable in this test. The number of degrees of freedom is df = n - 1. A test of a single variance may be right-tailed, left-tailed, or two-tailed. [link] will show you how to set up the null and alternative hypotheses. The null and alternative hypotheses contain statements about the population variance.
Math instructors are not only interested in how their students do on exams, on average, but how the exam scores vary. To many instructors, the variance (or standard deviation) may be more important than the average.
Suppose a math instructor believes that the standard deviation for his final exam is five points. One of his best students thinks otherwise. The student claims that the standard deviation is more than five points. If the student were to conduct a hypothesis test, what would the null and alternative hypotheses be?
Even though we are given the population standard deviation, we can set up the test using the population variance as follows.
A SCUBA instructor wants to record the collective depths each of his students dives during their checkout. He is interested in how the depths vary, even though everyone should have been at the same depth. He believes the standard deviation is three feet. His assistant thinks the standard deviation is less than three feet. If the instructor were to conduct a test, what would the null and alternative hypotheses be?
H 0 : σ 2 = 3 2
H a : σ 2 <3 2
With individual lines at its various windows, a post office finds that the standard deviation for normally distributed waiting times for customers on Friday afternoon is 7.2 minutes. The post office experiments with a single, main waiting line and finds that for a random sample of 25 customers, the waiting times for customers have a standard deviation of 3.5 minutes.
With a significance level of 5%, test the claim that a single line causes lower variation among waiting times (shorter waiting times) for customers .
Since the claim is that a single line causes less variation, this is a test of a single variance. The parameter is the population variance, σ 2 , or the population standard deviation, σ .
Random Variable: The sample standard deviation, s , is the random variable. Let s = standard deviation for the waiting times.
The word "less" tells you this is a left-tailed test.
Distribution for the test: , where:
Calculate the test statistic:
where n = 25, s = 3.5, and σ = 7.2.
Graph:
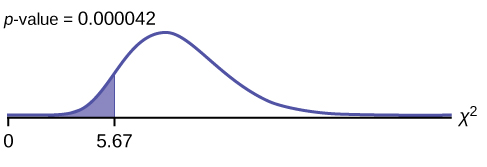
Probability statement: p -value = P ( χ 2 <5.67) = 0.000042
Compare
α and the
p -value:
Make a decision: Since α > p -value, reject H 0 . This means that you reject σ 2 = 7.2 2 . In other words, you do not think the variation in waiting times is 7.2 minutes; you think the variation in waiting times is less.
Conclusion: At a 5% level of significance, from the data, there is sufficient evidence to conclude that a single line causes a lower variation among the waiting times or with a single line, the customer waiting times vary less than 7.2 minutes.
In
2nd DISTR , use
7:χ2cdf . The syntax is
(lower, upper, df) for the parameter list.
For
[link] ,
χ2cdf(-1E99,5.67,24) . The
p -value = 0.000042.
The FCC conducts broadband speed tests to measure how much data per second passes between a consumer’s computer and the internet. As of August of 2012, the standard deviation of Internet speeds across Internet Service Providers (ISPs) was 12.2 percent. Suppose a sample of 15 ISPs is taken, and the standard deviation is 13.2. An analyst claims that the standard deviation of speeds is more than what was reported. State the null and alternative hypotheses, compute the degrees of freedom, the test statistic, sketch the graph of the p -value, and draw a conclusion. Test at the 1% significance level.
H 0 : σ 2 = 12.2 2
H
a :
σ
2 >12.2
2
df = 14
chi
2 test statistic = 16.39

The p -value is 0.2902, so we decline to reject the null hypothesis. There is not enough evidence to suggest that the variance is greater than 12.2 2 .
In
2nd DISTR , use7:
χ2cdf . The syntax is
(lower, upper, df) for the parameter list.
χ2cdf(16.39,10^99,14) . The
p -value = 0.2902.
“AppleInsider Price Guides.” Apple Insider, 2013. Available online at http://appleinsider.com/mac_price_guide (accessed May 14, 2013).
Data from the World Bank, June 5, 2012.
To test variability, use the chi-square test of a single variance. The test may be left-, right-, or two-tailed, and its hypotheses are always expressed in terms of the variance (or standard deviation).
Test of a single variance statistic where:
n : sample size
s : sample standard deviation
σ : population standard deviation
df = n – 1 Degrees of freedom
Use the following information to answer the next three exercises: An archer’s standard deviation for his hits is six (data is measured in distance from the center of the target). An observer claims the standard deviation is less.
What type of test should be used?
a test of a single variance
State the null and alternative hypotheses.
Is this a right-tailed, left-tailed, or two-tailed test?
a left-tailed test
Use the following information to answer the next three exercises: The standard deviation of heights for students in a school is 0.81. A random sample of 50 students is taken, and the standard deviation of heights of the sample is 0.96. A researcher in charge of the study believes the standard deviation of heights for the school is greater than 0.81.
What type of test should be used?
State the null and alternative hypotheses.
H 0 : σ 2 = 0.81 2 ;
H a : σ 2 >0.81 2
df = ________
Use the following information to answer the next four exercises: The average waiting time in a doctor’s office varies. The standard deviation of waiting times in a doctor’s office is 3.4 minutes. A random sample of 30 patients in the doctor’s office has a standard deviation of waiting times of 4.1 minutes. One doctor believes the variance of waiting times is greater than originally thought.
What type of test should be used?
a test of a single variance
What is the test statistic?
What can you conclude at the 5% significance level?
Notification Switch
Would you like to follow the 'Introductory statistics' conversation and receive update notifications?

|
|

|
|

|
|

|
|

|
|

|
|

|
|

|
|

|
|

|
|

|