

| << Chapter < Page | Chapter >> Page > |
| Type of Volunteer | 1–3 Hours | 4–6 Hours | 7–9 Hours | Row Total |
|---|---|---|---|---|
| Community College Students | 111 | 96 | 48 | 255 |
| Four-Year College Students | 96 | 133 | 61 | 290 |
| Nonstudents | 91 | 150 | 53 | 294 |
| Column Total | 298 | 379 | 162 | 839 |
Is the number of hours volunteered independent of the type of volunteer?
The observed table and the question at the end of the problem, "Is the number of hours volunteered independent of the type of volunteer?" tell you this is a test of independence. The two factors are number of hours volunteered and type of volunteer . This test is always right-tailed.
H 0 : The number of hours volunteered is independent of the type of volunteer.
H a : The number of hours volunteered is dependent on the type of volunteer.
The expected result are in [link] .
| Type of Volunteer | 1-3 Hours | 4-6 Hours | 7-9 Hours |
|---|---|---|---|
| Community College Students | 90.57 | 115.19 | 49.24 |
| Four-Year College Students | 103.00 | 131.00 | 56.00 |
| Nonstudents | 104.42 | 132.81 | 56.77 |
For example, the calculation for the expected frequency for the top left cell is
Calculate the test statistic: χ 2 = 12.99 (calculator or computer)
Distribution for the test:
df = (3 columns – 1)(3 rows – 1) = (2)(2) = 4
Graph:
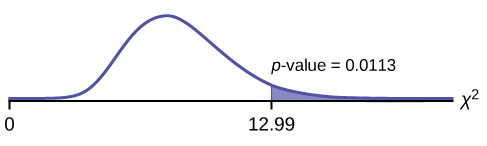
Probability statement: p -value= P ( χ 2 >12.99) = 0.0113
Compare α and the p -value: Since no α is given, assume α = 0.05. p -value = 0.0113. α > p -value.
Make a decision: Since α > p -value, reject H 0 . This means that the factors are not independent.
Conclusion: At a 5% level of significance, from the data, there is sufficient evidence to conclude that the number of hours volunteered and the type of volunteer are dependent on one another.
For the example in [link] , if there had been another type of volunteer, teenagers, what would the degrees of freedom be?
Press the
MATRX key and arrow over to
EDIT . Press
1:[A] . Press
3 ENTER 3 ENTER . Enter the table values by row from
[link] . Press
ENTER after each. Press
2nd QUIT . Press
STAT and arrow over to
TESTS . Arrow down to
C:χ2-TEST . Press
ENTER . You should see
Observed:[A] and Expected:[B] . Arrow down to
Calculate . Press
ENTER . The test statistic is 12.9909 and the
p -value = 0.0113. Do the procedure a second time, but arrow down to
Draw instead of
calculate .
The Bureau of Labor Statistics gathers data about employment in the United States. A sample is taken to calculate the number of U.S. citizens working in one of several industry sectors over time. [link] shows the results:
| Industry Sector | 2000 | 2010 | 2020 | Total |
|---|---|---|---|---|
| Nonagriculture wage and salary | 13,243 | 13,044 | 15,018 | 41,305 |
| Goods-producing, excluding agriculture | 2,457 | 1,771 | 1,950 | 6,178 |
| Services-providing | 10,786 | 11,273 | 13,068 | 35,127 |
| Agriculture, forestry, fishing, and hunting | 240 | 214 | 201 | 655 |
| Nonagriculture self-employed and unpaid family worker | 931 | 894 | 972 | 2,797 |
| Secondary wage and salary jobs in agriculture and private household industries | 14 | 11 | 11 | 36 |
| Secondary jobs as a self-employed or unpaid family worker | 196 | 144 | 152 | 492 |
| Total | 27,867 | 27,351 | 31,372 | 86,590 |
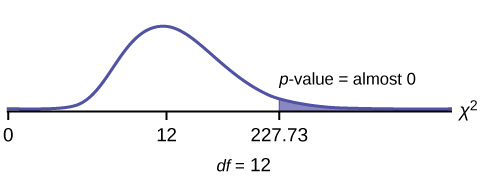
We want to know if the change in the number of jobs is independent of the change in years. State the null and alternative hypotheses and the degrees of freedom.
H 0 : The number of jobs is independent of the year.
H
a : The number of jobs is dependent on the year.
df = 12
Press the
MATRX key and arrow over to
EDIT . Press
1:[A] . Press
3 ENTER 3 ENTER . Enter the table values by row. Press
ENTER after each. Press
2nd QUIT . Press
STAT and arrow over to
TESTS . Arrow down to
C:χ2-TEST . Press
ENTER . You should see
Observed:[A] and Expected:[B] . Arrow down to
Calculate . Press
ENTER . The test statistic is 227.73 and the
p −value = 5.90E - 42 = 0. Do the procedure a second time but arrow down to
Draw instead of
calculate .
Notification Switch
Would you like to follow the 'Introductory statistics' conversation and receive update notifications?

|
|
|
|
|

|
|

|
|

|
|

|
|

|
|

|
|

|
|

|
|

|
|

|