

| << Chapter < Page | Chapter >> Page > |
Employers want to know which days of the week employees are absent in a five-day work week. Most employers would like to believe that employees are absent equally during the week. Suppose a random sample of 60 managers were asked on which day of the week they had the highest number of employee absences. The results were distributed as in [link] . For the population of employees, do the days for the highest number of absences occur with equal frequencies during a five-day work week? Test at a 5% significance level.
| Monday | Tuesday | Wednesday | Thursday | Friday | |
|---|---|---|---|---|---|
| Number of Absences | 15 | 12 | 9 | 9 | 15 |
The null and alternative hypotheses are:
If the absent days occur with equal frequencies, then, out of 60 absent days (the total in the sample: 15 + 12 + 9 + 9 + 15 = 60), there would be 12 absences on Monday, 12 on Tuesday, 12 on Wednesday, 12 on Thursday, and 12 on Friday. These numbers are the expected ( E ) values. The values in the table are the observed ( O ) values or data.
This time, calculate the χ 2 test statistic by hand. Make a chart with the following headings and fill in the columns:
Now add (sum) the last column. The sum is three. This is the χ 2 test statistic.
To find the p -value, calculate P ( χ 2 >3). This test is right-tailed. (Use a computer or calculator to find the p -value. You should get p -value = 0.5578.)
The dfs are the number of cells – 1 = 5 – 1 = 4
Press
2nd DISTR . Arrow down to
χ
2  cdf
. Press
ENTER . Enter
(3,10^99,4) . Rounded to four decimal places, you should see 0.5578, which is the p-value.
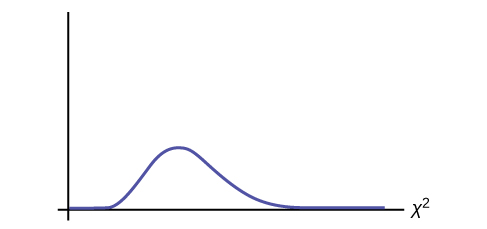
Next, complete a graph like the following one with the proper labeling and shading. (You should shade the right tail.)
The decision is not to reject the null hypothesis.
Conclusion: At a 5% level of significance, from the sample data, there is not sufficient evidence to conclude that the absent days do not occur with equal frequencies.
TI-83+ and some TI-84 calculators do not have a special program for the test statistic for the goodness-of-fit test. The next example
[link] has the calculator instructions. The newer TI-84 calculators have in
STAT TESTS the test
Chi2 GOF . To run the test, put the observed values (the data) into a first list and the expected values (the values you expect if the null hypothesis is true) into a second list. Press
STAT TESTS and
Chi2 GOF . Enter the list names for the Observed list and the Expected list. Enter the degrees of freedom and press
calculate or
draw . Make sure you clear any lists before you start.
To Clear Lists in the calculators: Go into
STAT EDIT and arrow up to the list name area of the particular list. Press
CLEAR and then arrow down. The list will be cleared. Alternatively, you can press
STAT and press 4 (for
ClrList ). Enter the list name and press
ENTER .
Teachers want to know which night each week their students are doing most of their homework. Most teachers think that students do homework equally throughout the week. Suppose a random sample of 49 students were asked on which night of the week they did the most homework. The results were distributed as in [link] .
| Sunday | Monday | Tuesday | Wednesday | Thursday | Friday | Saturday | |
|---|---|---|---|---|---|---|---|
| Number of Students | 11 | 8 | 10 | 7 | 10 | 5 | 5 |
From the population of students, do the nights for the highest number of students doing the majority of their homework occur with equal frequencies during a week? What type of hypothesis test should you use?
df = 6
p -value = 0.6093
We decline to reject the null hypothesis. There is not enough evidence to support that students do not do the majority of their homework equally throughout the week.
Notification Switch
Would you like to follow the 'Introductory statistics' conversation and receive update notifications?

|
|
|
|
|

|
|
|
|
|

|
|

|
|

|
|

|
|

|
|

|
|

|
|

|