<< Chapter < Page Chapter >> Page >
This module provides an overview of Hypothesis Testing: Matched or Paired Samples as a part of Collaborative Statistics collection (col10522) by Barbara Illowsky and Susan Dean.
  1. Simple random sampling is used.
  2. Sample sizes are often small.
  3. Two measurements (samples) are drawn from the same pair of individuals or objects.
  4. Differences are calculated from the matched or paired samples.
  5. The differences form the sample that is used for the hypothesis test.
  6. The matched pairs have differences that either come from a population that is normal or the number of differences is sufficiently large so the distribution of the sample mean of differences is approximately normal.

In a hypothesis test for matched or paired samples, subjects are matched in pairs and differences are calculated. The differences are the data. Thepopulation mean for the differences, μ d , is then tested using a Student-t test for a single population mean with n - 1 degrees of freedom where n is the number of differences.

The test statistic (t-score) is:

t = x d ¯ μ d ( s d n )

Matched or paired samples

A study was conducted to investigate the effectiveness of hypnotism in reducing pain. Results forrandomly selected subjects are shown in the table. The "before" value is matched to an "after" value and the differences are calculated. The differences have a normal distribution.

Subject: A B C D E F G H
Before 6.6 6.5 9.0 10.3 11.3 8.1 6.3 11.6
After 6.8 2.4 7.4 8.5 8.1 6.1 3.4 2.0

Are the sensory measurements, on average, lower after hypnotism? Test at a 5% significance level.

Corresponding "before" and "after" values form matched pairs. (Calculate "sfter" - "before").

After Data Before Data Difference
6.8 6.6 0.2
2.4 6.5 -4.1
7.4 9 -1.6
8.5 10.3 -1.8
8.1 11.3 -3.2
6.1 8.1 -2
3.4 6.3 -2.9
2 11.6 -9.6

The data for the test are the differences:{0.2, -4.1, -1.6, -1.8, -3.2, -2, -2.9, -9.6}

The sample mean and sample standard deviation of the differences are: x d = -3.13 and s d = 2.91 Verify these values.

Let μ d be the population mean for the differences. We use the subscript d to denote "differences."

Random Variable: X d = the mean difference of the sensory measurements

H o : μ d 0
There is no improvement. ( μ d is the population mean of the differences.)

H a : μ d < 0
There is improvement. The score should be lower after hypnotism so the difference ought to be negativeto indicate improvement.

Distribution for the test: The distribution is a student-t with df = n - 1 = 8 - 1 = 7 . Use t 7 . (Notice that the test is for a single population mean.)

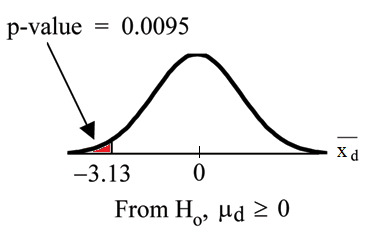
Calculate the p-value using the Student-t distribution: p-value = 0.0095

Graph:

Normal distribution curve of the average difference of sensory measurements with values of -3.13 and 0. A vertical upward line extends from -3.13 to the curve, and the p-value is indicated in the area to the left of this value.

X d is the random variable for thedifferences.

The sample mean and sample standarddeviation of the differences are:

x d = -3.13

s d = 2.91

Compare α and the p-value: α = 0.05 and p-value = 0.0095 . α > p-value .

Make a decision: Since α > p-value , reject H o .

This means that μ d < 0 and there is improvement.

Conclusion: At a 5% level of significance, from the sample data, there is sufficient evidence to conclude that the sensory measurements, on average, are lower afterhypnotism. Hypnotism appears to be effective in reducing pain.

For the TI-83+ and TI-84 calculators, you can either calculate the differences ahead of time ( after - before ) and put the differences into a list or you can put the after data into a first list and the before data into a second list. Then go to a third list and arrow up to the name. Enter 1st list name - 2nd list name. The calculatorwill do the subtraction and you will have the differences in the third list.
TI-83+ and TI-84: Use your list of differences as the data. Press STAT and arrow over to TESTS . Press 2:T-Test . Arrow over to Data and press ENTER . Arrow down and enter 0 for μ 0 , the name of the list where you put the data, and 1 for Freq:. Arrow down to μ : and arrow over to < μ 0 . Press ENTER . Arrow down to Calculate and press ENTER . The p-value is 0.0094 and the test statistic is -3.04. Do these instructions again exceptarrow to Draw (instead of Calculate ). Press ENTER .
Got questions? Get instant answers now!

A college football coach was interested in whether the college's strength development class increased his players' maximum lift (in pounds) on the benchpress exercise. He asked 4 of his players to participate in a study. The amount of weight they could each lift was recorded before they took the strength developmentclass. After completing the class, the amount of weight they could each lift was again measured. The data are as follows:

Weight (in pounds) Player 1 Player 2 Player 3 Player 4
Amount of weighted lifted prior to the class 205 241 338 368
Amount of weight lifted after the class 295 252 330 360

The coach wants to know if the strength development class makes his players stronger, on average.

Record the differences data. Calculate the differences by subtracting the amount of weight lifted prior to the class from the weight lifted after completing the class. Thedata for the differences are: {90, 11, -8, -8}. The differences have a normal distribution.

Using the differences data, calculate the sample mean and the sample standard deviation.

x d = 21.3 s d = 46.7

Using the difference data, this becomes a test of a single __________ (fill in the blank).

Define the random variable: X d = mean difference in the maximum lift per player.

The distribution for the hypothesis test is t 3 .

H o : μ d 0 H a : μ d > 0

Graph:

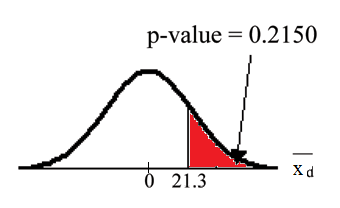
Normal distribution curve with values of 0 and 21.3. A vertical upward line extends from 21.3 to the curve and the p-value is indicated in the area to the right of this value.

Calculate the p-value: The p-value is 0.2150

Decision: If the level of significance is 5%, the decision is to not reject the null hypothesis because α < p-value .

What is the conclusion?

means; At a 5% level of significance, from the sample data, there is not sufficient evidence to conclude that the strength development class helped to make the players stronger, on average.

Got questions? Get instant answers now!

Seven eighth graders at Kennedy Middle School measured how farthey could push the shot-put with their dominant (writing) hand and their weaker (non-writing) hand. They thought that they could push equal distances with eitherhand. The following data was collected.

Distance (in feet) using Student 1 Student 2 Student 3 Student 4 Student 5 Student 6 Student 7
Dominant Hand 30 26 34 17 19 26 20
Weaker Hand 28 14 27 18 17 26 16

Conduct a hypothesis test to determine whether the mean difference in distances between the children's dominant versus weaker hands is significant.

use a t-test on the difference data. Assume the differences have a normal distribution. The random variable is the mean difference.

The test statistic is 2.18 and the p-value is 0.0716.

What is your conclusion?

H 0 : μ d equals 0; H a : μ d does not equal 0; Do not reject the null; At a 5% significance level, from the sample data, there is not sufficient evidence to conclude that the mean difference in distances between the children's dominant versus weaker hands is significant (there is not sufficient evidence to show that the children could push the shot-put further with their dominant hand). Alpha and the p-value are close so the test is not strong.

Got questions? Get instant answers now!

Questions & Answers

how does Neisseria cause meningitis
Nyibol Reply
what is microbiologist
Muhammad Reply
what is errata
Muhammad
is the branch of biology that deals with the study of microorganisms.
Ntefuni Reply
What is microbiology
Mercy Reply
studies of microbes
Louisiaste
when we takee the specimen which lumbar,spin,
Ziyad Reply
How bacteria create energy to survive?
Muhamad Reply
Bacteria doesn't produce energy they are dependent upon their substrate in case of lack of nutrients they are able to make spores which helps them to sustain in harsh environments
_Adnan
But not all bacteria make spores, l mean Eukaryotic cells have Mitochondria which acts as powerhouse for them, since bacteria don't have it, what is the substitution for it?
Muhamad
they make spores
Louisiaste
what is sporadic nd endemic, epidemic
Aminu Reply
the significance of food webs for disease transmission
Abreham
food webs brings about an infection as an individual depends on number of diseased foods or carriers dully.
Mark
explain assimilatory nitrate reduction
Esinniobiwa Reply
Assimilatory nitrate reduction is a process that occurs in some microorganisms, such as bacteria and archaea, in which nitrate (NO3-) is reduced to nitrite (NO2-), and then further reduced to ammonia (NH3).
Elkana
This process is called assimilatory nitrate reduction because the nitrogen that is produced is incorporated in the cells of microorganisms where it can be used in the synthesis of amino acids and other nitrogen products
Elkana
Examples of thermophilic organisms
Shu Reply
Give Examples of thermophilic organisms
Shu
advantages of normal Flora to the host
Micheal Reply
Prevent foreign microbes to the host
Abubakar
they provide healthier benefits to their hosts
ayesha
They are friends to host only when Host immune system is strong and become enemies when the host immune system is weakened . very bad relationship!
Mark
what is cell
faisal Reply
cell is the smallest unit of life
Fauziya
cell is the smallest unit of life
Akanni
ok
Innocent
cell is the structural and functional unit of life
Hasan
is the fundamental units of Life
Musa
what are emergency diseases
Micheal Reply
There are nothing like emergency disease but there are some common medical emergency which can occur simultaneously like Bleeding,heart attack,Breathing difficulties,severe pain heart stock.Hope you will get my point .Have a nice day ❣️
_Adnan
define infection ,prevention and control
Innocent
I think infection prevention and control is the avoidance of all things we do that gives out break of infections and promotion of health practices that promote life
Lubega
Heyy Lubega hussein where are u from?
_Adnan
en français
Adama
which site have a normal flora
ESTHER Reply
Many sites of the body have it Skin Nasal cavity Oral cavity Gastro intestinal tract
Safaa
skin
Asiina
skin,Oral,Nasal,GIt
Sadik
How can Commensal can Bacteria change into pathogen?
Sadik
How can Commensal Bacteria change into pathogen?
Sadik
all
Tesfaye
by fussion
Asiina
what are the advantages of normal Flora to the host
Micheal
what are the ways of control and prevention of nosocomial infection in the hospital
Micheal
what is inflammation
Shelly Reply
part of a tissue or an organ being wounded or bruised.
Wilfred
what term is used to name and classify microorganisms?
Micheal Reply
Binomial nomenclature
adeolu
Got questions? Join the online conversation and get instant answers!
Jobilize.com Reply

Get Jobilize Job Search Mobile App in your pocket Now!

Get it on Google Play Download on the App Store Now


Source:  OpenStax, Collaborative statistics. OpenStax CNX. Jul 03, 2012 Download for free at http://cnx.org/content/col10522/1.40
Google Play and the Google Play logo are trademarks of Google Inc.

Notification Switch

Would you like to follow the 'Collaborative statistics' conversation and receive update notifications?

Ask