<< Chapter < Page Chapter >> Page >
  1. The two independent samples are simple random samples that are independent.
  2. The number of successes is at least five and the number of failures is at least five for each of the samples.

Comparing two proportions, like comparing two means, is common. If two estimated proportions are different, it may be due to a difference in the populationsor it may be due to chance. A hypothesis test can help determine if a difference in the estimated proportions ( P A ' P B ' ) reflects a difference in the population proportions.

The difference of two proportions follows an approximate normal distribution. Generally, the null hypothesis states that the two proportions are the same. That is, H o : p A = p B . To conduct the test, we use a pooled proportion, p c .

The pooled proportion is calculated as follows:

p c = x A + x B n A + n B

The distribution for the differences is:

P ' A P ' B ~ N [ 0 , p c · ( 1 p c ) · ( 1 n A + 1 n B ) ]

The test statistic (z-score) is:

z = ( p ' A p ' B ) ( p A p B ) p c · ( 1 p c ) · ( 1 n A + 1 n B )

Two population proportions

Two types of medication for hives are being tested to determine if there is a difference in the proportions of adult patient reactions. Twenty out of a random sample of 200 adults given medication A still had hives 30 minutes after taking the medication. Twelve out of another random sample of 200 adults given medication B still had hives 30 minutes after taking the medication. Test at a 1% level of significance.

Determining the solution

This is a test of 2 population proportions.

How do you know?

The problem asks for a difference in proportions.

Got questions? Get instant answers now!

Let A and B be the subscripts for medication A and medication B. Then p A and p B are the desired population proportions.

Random variable:

P' A P' B = difference in the proportions of adult patients who did not react after 30 minutes to medication A and medication B.

H o : p A = p B p A - p B = 0

H a : p A p B p A - p B 0

The words "is a difference" tell you the test is two-tailed.

Distribution for the test: Since this is a test of two binomial population proportions, the distribution is normal:

p c = x A + x B n A + n B = 20 + 12 200 + 200 = 0.08 1 p c = 0.92

Therefore, P' A P' B ~ N [ 0 , ( 0.08 ) ( 0.92 ) ( 1 200 + 1 200 ) ]

P' A P' B follows an approximate normal distribution.

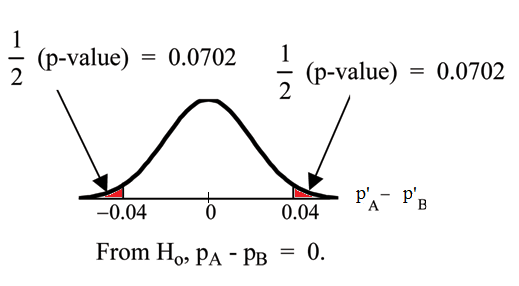
Calculate the p-value using the normal distribution: p-value = 0.1404.

Estimated proportion for group A: p' A = x A n A = 20 200 = 0.1

Estimated proportion for group B: p' B = x B n B = 12 200 = 0.06

Graph:

Normal distribution curve of the difference in the percentages of adult patients who don't react to medication A and B after 30 minutes. The x-axis has values of -0.04 and 0.04. Two vertical upward lines extend from these values to the curve. 1/2(p-values) point to the areas on either side of these values.

P' A P' B = 0.1 - 0.06 = 0.04 .

Half the p-value is below -0.04 andhalf is above 0.04.

Compare α and the p-value: α = 0.01 and the p-value = 0.1404 . α < p-value.

Make a decision: Since α < p-value , do not reject H o .

Conclusion: At a 1% level of significance, from the sample data, there is not sufficient evidence to conclude that there is a difference in the proportions of adultpatients who did not react after 30 minutes to medication A and medication B.

TI-83+ and TI-84: Press STAT . Arrow over to TESTS and press 6:2-PropZTest . Arrow down and enter 20 for x1 , 200 for n1 , 12 for x2 , and 200 for n2 . Arrow down to p1 : and arrow to not equal p2 . Press ENTER . Arrow down to Calculate and press ENTER . The p-value is p = 0.1404 and the test statistic is 1.47. Do the procedure again but instead of Calculate do Draw .

Questions & Answers

Ayele, K., 2003. Introductory Economics, 3rd ed., Addis Ababa.
Widad Reply
can you send the book attached ?
Ariel
?
Ariel
What is economics
Widad Reply
the study of how humans make choices under conditions of scarcity
AI-Robot
U(x,y) = (x×y)1/2 find mu of x for y
Desalegn Reply
U(x,y) = (x×y)1/2 find mu of x for y
Desalegn
what is ecnomics
Jan Reply
this is the study of how the society manages it's scarce resources
Belonwu
what is macroeconomic
John Reply
macroeconomic is the branch of economics which studies actions, scale, activities and behaviour of the aggregate economy as a whole.
husaini
etc
husaini
difference between firm and industry
husaini Reply
what's the difference between a firm and an industry
Abdul
firm is the unit which transform inputs to output where as industry contain combination of firms with similar production 😅😅
Abdulraufu
Suppose the demand function that a firm faces shifted from Qd  120 3P to Qd  90  3P and the supply function has shifted from QS  20  2P to QS 10  2P . a) Find the effect of this change on price and quantity. b) Which of the changes in demand and supply is higher?
Toofiq Reply
explain standard reason why economic is a science
innocent Reply
factors influencing supply
Petrus Reply
what is economic.
Milan Reply
scares means__________________ends resources. unlimited
Jan
economics is a science that studies human behaviour as a relationship b/w ends and scares means which have alternative uses
Jan
calculate the profit maximizing for demand and supply
Zarshad Reply
Why qualify 28 supplies
Milan
what are explicit costs
Nomsa Reply
out-of-pocket costs for a firm, for example, payments for wages and salaries, rent, or materials
AI-Robot
concepts of supply in microeconomics
David Reply
economic overview notes
Amahle Reply
identify a demand and a supply curve
Salome Reply
i don't know
Parul
there's a difference
Aryan
Demand curve shows that how supply and others conditions affect on demand of a particular thing and what percent demand increase whith increase of supply of goods
Israr
Hi Sir please how do u calculate Cross elastic demand and income elastic demand?
Abari
Got questions? Join the online conversation and get instant answers!
Jobilize.com Reply

Get Jobilize Job Search Mobile App in your pocket Now!

Get it on Google Play Download on the App Store Now


Source:  OpenStax, Collaborative statistics. OpenStax CNX. Jul 03, 2012 Download for free at http://cnx.org/content/col10522/1.40
Google Play and the Google Play logo are trademarks of Google Inc.

Notification Switch

Would you like to follow the 'Collaborative statistics' conversation and receive update notifications?

Ask