

| << Chapter < Page | Chapter >> Page > |
The science of statistics deals with the collection, analysis, interpretation, and presentation of data . We see and use data in our everyday lives.
In your classroom, try this exercise. Have class members write down the average time (in hours, to the nearest half-hour) they sleep per night. Your instructor will record the data. Then create a simple graph (called a dot plot ) of the data. A dot plot consists of a number line and dots (or points) positioned above the number line. For example, consider the following data:
The dot plot for this data would be as follows:
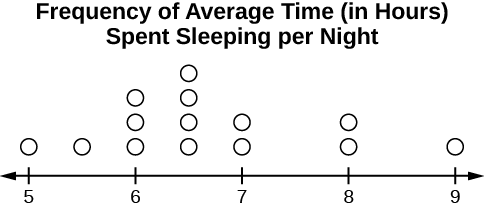 image -->
 Does your dot plot look the same as or different from the example? Why? If you did the same example in an English class with the same number of students, do you think the results would be the same? Why or why not?
Where do your data appear to cluster? How might you interpret the clustering?
The questions above ask you to analyze and interpret your data. With this example, you have begun your study of statistics.
In this course, you will learn how to organize and summarize data. Organizing and summarizing data is called descriptive statistics . Two ways to summarize data are by graphing and by using numbers (for example, finding an average). After you have studied probability and probability distributions, you will use formal methods for drawing conclusions from "good" data. The formal methods are called inferential statistics . Statistical inference uses probability to determine how confident we can be that our conclusions are correct.
Effective interpretation of data (inference) is based on good procedures for producing data and thoughtful examination of the data. You will encounter what will seem to be too many mathematical formulas for interpreting data. The goal of statistics is not to perform numerous calculations using the formulas, but to gain an understanding of your data. The calculations can be done using a calculator or a computer. The understanding must come from you. If you can thoroughly grasp the basics of statistics, you can be more confident in the decisions you make in life.
Probability is a mathematical tool used to study randomness. It deals with the chance (the likelihood) of an event occurring. For example, if you toss a fair coin four times, the outcomes may not be two heads and two tails. However, if you toss the same coin 4,000 times, the outcomes will be close to half heads and half tails. The expected theoretical probability of heads in any one toss is or 0.5. Even though the outcomes of a few repetitions are uncertain, there is a regular pattern of outcomes when there are many repetitions. After reading about the English statistician Karl Pearson who tossed a coin 24,000 times with a result of 12,012 heads, one of the authors tossed a coin 2,000 times. The results were 996 heads. The fraction is equal to 0.498 which is very close to 0.5, the expected probability.
The theory of probability began with the study of games of chance such as poker. Predictions take the form of probabilities. To predict the likelihood of an earthquake, of rain, or whether you will get an A in this course, we use probabilities. Doctors use probability to determine the chance of a vaccination causing the disease the vaccination is supposed to prevent. A stockbroker uses probability to determine the rate of return on a client's investments. You might use probability to decide to buy a lottery ticket or not. In your study of statistics, you will use the power of mathematics through probability calculations to analyze and interpret your data.
Notification Switch
Would you like to follow the 'Introductory statistics' conversation and receive update notifications?

|
|

|
|

|
|

|
|

|
|

|
|

|
|

|
|

|
|

|
|

|