Class Time: __________________________
Name: _____________________________________
H
0 : _______
H
a : _______
In words,
CLEARLY state what your random variable
or
represents.
State the distribution to use for the test.
What is the test statistic?
What is the
p -value? In one or two complete sentences, explain what the
p -value means for this problem.
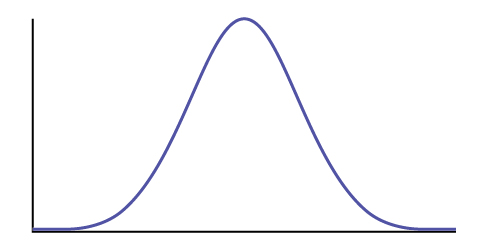
Use the previous information to sketch a picture of this situation. CLEARLY, label and scale the horizontal axis and shade the region(s) corresponding to the
p -value.
Indicate the correct decision (“reject” or “do not reject” the null hypothesis), the reason for it, and write an appropriate conclusion, using
complete sentences .
Alpha: _______
Decision: _______
Reason for decision: _______
Conclusion: _______
Construct a 95% confidence interval for the true mean or proportion. Include a sketch of the graph of the situation. Label the point estimate and the lower and upper bounds of the confidence interval.
Hypothesis testing with two samples
Class Time: __________________________
Name: _____________________________________
H
0 : _______
H
a : _______
In words,
clearly state what your random variable
,
or
represents.
State the distribution to use for the test.
What is the test statistic?
What is the
p -value? In one to two complete sentences, explain what the p-value means for this problem.
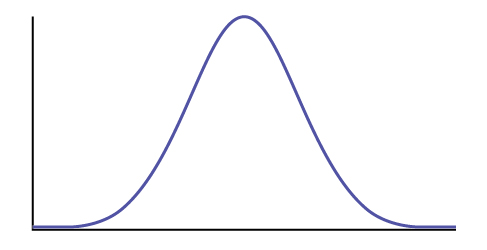
Use the previous information to sketch a picture of this situation.
CLEARLY label and scale the horizontal axis and shade the region(s) corresponding to the
p -value.
Indicate the correct decision (“reject” or “do not reject” the null hypothesis), the reason for it, and write an appropriate conclusion, using
complete sentences .
Alpha: _______
Decision: _______
Reason for decision: _______
Conclusion: _______
In complete sentences, explain how you determined which distribution to use.
The chi-square distribution
Class Time: __________________________
Name: ____________________________________
H
0 : _______
H
a : _______
What are the degrees of freedom?
State the distribution to use for the test.
What is the test statistic?
What is the
p -value? In one to two complete sentences, explain what the
p -value means for this problem.
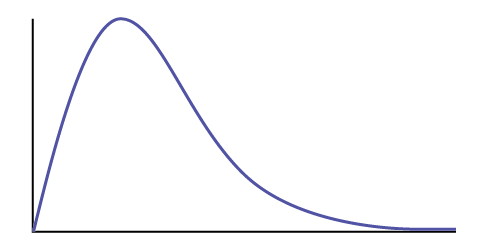
Use the previous information to sketch a picture of this situation.
Clearly label and scale the horizontal axis and shade the region(s) corresponding to the
p -value.
Indicate the correct decision (“reject” or “do not reject” the null hypothesis) and write appropriate conclusions, using
complete sentences.
Alpha: _______
Decision: _______
Reason for decision: _______
Conclusion: _______
F distribution and one-way anova
Class Time: __________________________
Name: ____________________________________
H
0 : _______
H
a : _______
df (
n ) = ______
df (
d ) = _______
State the distribution to use for the test.
What is the test statistic?
What is the
p -value?
Use the previous information to sketch a picture of this situation.
Clearly label and scale the horizontal axis and shade the region(s) corresponding to the
p -value.
Indicate the correct decision (“reject” or “do not reject” the null hypothesis) and write appropriate conclusions, using
complete sentences .
Alpha: _______
Decision: _______
Reason for decision: _______
Conclusion: _______
Questions & Answers
Ayele, K., 2003. Introductory Economics, 3rd ed., Addis Ababa.
what's the difference between a firm and an industry
Abdul
firm is the unit which transform inputs to output where as industry contain combination of firms with similar production 😅😅
Abdulraufu
Suppose the demand function that a firm faces shifted from
Qd 120 3P
to
Qd 90 3P
and the supply function has shifted from
QS
20 2P
to
QS
10 2P .
a) Find the effect of this change on price and quantity.
b) Which of the changes in demand and supply is higher?
Demand curve shows that how supply and others conditions affect on demand of a particular thing and what percent demand increase whith increase of supply of goods
Israr
Hi Sir please how do u calculate Cross elastic demand and income elastic demand?
Abari
Got questions? Join the online conversation and get instant answers!