<< Chapter < Page
  Introductory statistics     Page 25 / 36
Chapter >> Page >

2 . To complete a painting job requires four hours setup time plus one hour per 1,000 square feet. How would you express this information in a linear equation?

3 . A statistics instructor is paid a per-class fee of $2,000 plus $100 for each student in the class. How would you express this information in a linear equation?

4 . A tutoring school requires students to pay a one-time enrollment fee of $500 plus tuition of $3,000 per year. Express this information in an equation.

12.2: slope and Y -intercept of a linear equation

Use the following information to answer the next four exercises. For the labor costs of doing repairs, an auto mechanic charges a flat fee of $75 per car, plus an hourly rate of $55.

5 . What are the independent and dependent variables for this situation?

6 . Write the equation and identify the slope and intercept.

7 . What is the labor charge for a job that takes 3.5 hours to complete?

8 . One job takes 2.4 hours to complete, while another takes 6.3 hours. What is the difference in labor costs for these two jobs?

12.3: scatter plots

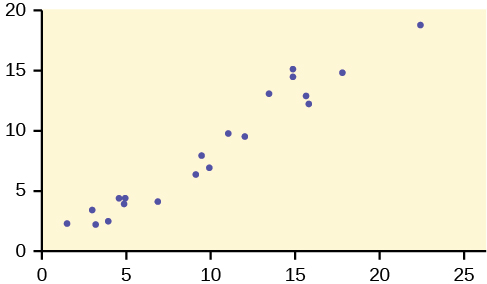
9 . Describe the pattern in this scatter plot, and decide whether the X and Y variables would be good candidates for linear regression.

This is a scatterplot. The points in the plot show a fairly strong, linear, uphill trend.

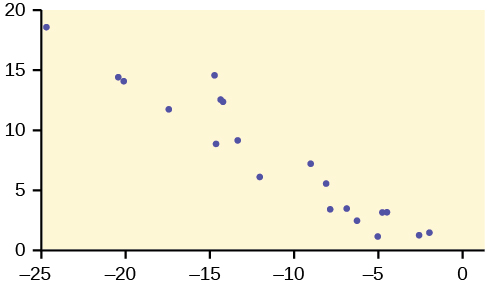
10 . Describe the pattern in this scatter plot, and decide whether the X and Y variables would be good candidates for linear regression.

This is a scatterplot. The points in the plot show a moderately strong, linear, downhill trend.

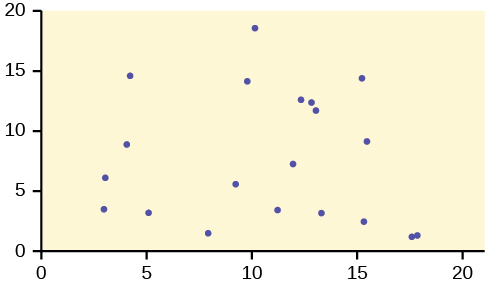
11 . Describe the pattern in this scatter plot, and decide whether the X and Y variables would be good candidates for linear regression.

This is a scatterplot. The points in the plot are spread across the graph and do not exhibit a strong trend of any kind.

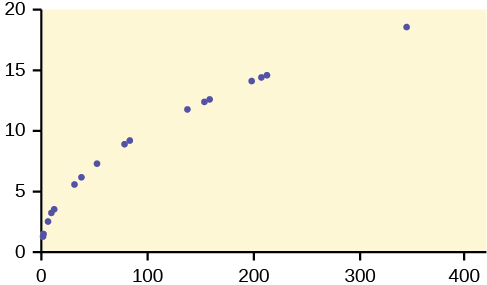
12 . Describe the pattern in this scatter plot, and decide whether the X and Y variables would be good candidates for linear regression.

This is a scatterplot. The points in the plot show a strong, curved, upward trend.

12.4: the regression equation

Use the following information to answer the next four exercises. Height (in inches) and weight (In pounds) in a sample of college freshman men have a linear relationship with the following summary statistics:
x ¯ = 68.4
y ¯ =141.6
s x = 4.0
s y = 9.6
r = 0.73
Let Y = weight and X = height, and write the regression equation in the form:
y ^ = a + b x

13 . What is the value of the slope?

14 . What is the value of the y intercept?

15 . Write the regression equation predicting weight from height in this data set, and calculate the predicted weight for someone 68 inches tall.

12.5: correlation coefficient and coefficient of determination

16 . The correlation between body weight and fuel efficiency (measured as miles per gallon) for a sample of 2,012 model cars is –0.56. Calculate the coefficient of determination for this data and explain what it means.

17 . The correlation between high school GPA and freshman college GPA for a sample of 200 university students is 0.32. How much variation in freshman college GPA is not explained by high school GPA?

18 . Rounded to two decimal places what correlation between two variables is necessary to have a coefficient of determination of at least 0.50?

12.6: testing the significance of the correlation coefficient

19 . Write the null and alternative hypotheses for a study to determine if two variables are significantly correlated.

20 . In a sample of 30 cases, two variables have a correlation of 0.33. Do a t -test to see if this result is significant at the α = 0.05 level. Use the formula:
t = r n 2 1 r 2

Questions & Answers

how do you get the 2/50
Abba Reply
number of sport play by 50 student construct discrete data
Aminu Reply
width of the frangebany leaves on how to write a introduction
Theresa Reply
Solve the mean of variance
Veronica Reply
Step 1: Find the mean. To find the mean, add up all the scores, then divide them by the number of scores. ... Step 2: Find each score's deviation from the mean. ... Step 3: Square each deviation from the mean. ... Step 4: Find the sum of squares. ... Step 5: Divide the sum of squares by n – 1 or N.
kenneth
what is error
Yakuba Reply
Is mistake done to something
Vutshila
Hy
anas
hy
What is the life teble
anas
hy
Jibrin
statistics is the analyzing of data
Tajudeen Reply
what is statics?
Zelalem Reply
how do you calculate mean
Gloria Reply
diveving the sum if all values
Shaynaynay
let A1,A2 and A3 events be independent,show that (A1)^c, (A2)^c and (A3)^c are independent?
Fisaye Reply
what is statistics
Akhisani Reply
data collected all over the world
Shaynaynay
construct a less than and more than table
Imad Reply
The sample of 16 students is taken. The average age in the sample was 22 years with astandard deviation of 6 years. Construct a 95% confidence interval for the age of the population.
Aschalew Reply
Bhartdarshan' is an internet-based travel agency wherein customer can see videos of the cities they plant to visit. The number of hits daily is a normally distributed random variable with a mean of 10,000 and a standard deviation of 2,400 a. what is the probability of getting more than 12,000 hits? b. what is the probability of getting fewer than 9,000 hits?
Akshay Reply
Bhartdarshan'is an internet-based travel agency wherein customer can see videos of the cities they plan to visit. The number of hits daily is a normally distributed random variable with a mean of 10,000 and a standard deviation of 2,400. a. What is the probability of getting more than 12,000 hits
Akshay
1
Bright
Sorry i want to learn more about this question
Bright
Someone help
Bright
a= 0.20233 b=0.3384
Sufiyan
a
Shaynaynay
How do I interpret level of significance?
Mohd Reply
It depends on your business problem or in Machine Learning you could use ROC- AUC cruve to decide the threshold value
Shivam
how skewness and kurtosis are used in statistics
Owen Reply
yes what is it
Taneeya

Get Jobilize Job Search Mobile App in your pocket Now!

Get it on Google Play Download on the App Store Now


Source:  OpenStax, Introductory statistics. OpenStax CNX. May 06, 2016 Download for free at http://legacy.cnx.org/content/col11562/1.18
Google Play and the Google Play logo are trademarks of Google Inc.

Notification Switch

Would you like to follow the 'Introductory statistics' conversation and receive update notifications?

Ask