<< Chapter < Page Chapter >> Page >

A graph titled Public Elementary-Secondary School System Revenue by Source and State: Fiscal Year 2012. The graph shows how much money schools in all 50 states get from federal revenue, state revenue, and local revenue. South Dakota gets about 1.2 billion total funding. North Dakota gets about 1.2 billion total funding.  The District of Columbia gets about 1.25 billion total funding.  Vermont gets about 1.6 billion in funding. Montana gets about 1.62 billion total funding.  Wyoming gets about 1.62 billion in funding. Delaware gets about 1.8 billion total funding. Idaho gets about 1.9 billion total funding. Rhode Island gets about 2.1 billion total funding.  Alaska gets about 2.2 billion total funding. Hawaii gets about 2.5 billion total funding. Maine gets about 2.5 billion total funding. New Hampshire gets about 2.7 billion total funding. New Mexico gets about 3.5 billon total funding.  Nebraska gets about 3.6 billion total funding. West Virginia gets about 3.9 billion total funding. Nevada gets about 4.1 billion total funding. Utah gets about 4.15 billion total funding. Mississippi gets about 4.3 billion total funding. Arkansas gets about 5.1 billion total funding. Kansas gets about 5.5 billion total funding. Oklahoma gets about 5.6 billion total funding. Iowa gets about 6 billion total funding. Oregon gets about 6 billion total funding. Alabama gets about 7 billion total funding. Kentucky gets about 7 billion total funding. Arizona gets about 7.2 billion total funding. South Carolina gets about 7.2 billion total funding. Louisiana gets about 7.3 billion total funding. Colorado gets about 8 billion total funding. Tennessee gets about 8.3 billion total funding. Connecticut gets about 9.9 billion total funding. Missouri gets about 9.9 billion total funding. Wisconsin gets about 11 billion total funding. Washington gets about 12 billion total funding. Indiana gets about 13 billion total funding. North Carolina gets about 13.5 billion total funding. Maryland gets about 14 billion total funding. Virginia gets about 10.5 billion total funding. Massachusetts gets about 16 billion total funding. Georgia gets about 18 billion total funding. Michigan 18 billion total funding. Ohio gets about 22 billion total funding. Florida gets about 24 billion total funding. Pennsylvania gets about 26 billion total funding. New Jersey gets about 24 billion total funding. Illinois gets about 28 billion total funding.  Texas gets about 49 billion total funding. New York gets about 58 billion total funding. California gets about 65 billion total funding.
How has your state’s revenue affected your educational opportunities? (Graph courtesy of Census of Governments: Survey of School System Finances 2012)

A precedent for universal access to education in the United States was set with the 1972 U.S. District Court for the District of Columbia’s decision in Mills v. Board of Education of the District of Columbia . This case was brought on the behalf of seven school-age children with special needs who argued that the school board was denying their access to free public education. The school board maintained that the children’s “exceptional” needs, which included mental retardation and mental illness, precluded their right to be educated for free in a public school setting. The board argued that the cost of educating these children would be too expensive and that the children would therefore have to remain at home without access to education.

This case was resolved in a hearing without any trial. The judge, Joseph Cornelius Waddy, upheld the students’ right to education, finding that they were to be given either public education services or private education paid for by the Washington, D.C., board of education. He noted that

Constitutional rights must be afforded citizens despite the greater expense involved … the District of Columbia’s interest in educating the excluded children clearly must outweigh its interest in preserving its financial resources. … The inadequacies of the District of Columbia Public School System whether occasioned by insufficient funding or administrative inefficiency, certainly cannot be permitted to bear more heavily on the “exceptional” or handicapped child than on the normal child ( Mills v. Board of Education 1972).

Today, the optimal way to include differently abled students in standard classrooms is still being researched and debated. “Inclusion” is a method that involves complete immersion in a standard classroom, whereas “mainstreaming” balances time in a special-needs classroom with standard classroom participation. There continues to be social debate surrounding how to implement the ideal of universal access to education.

Summary

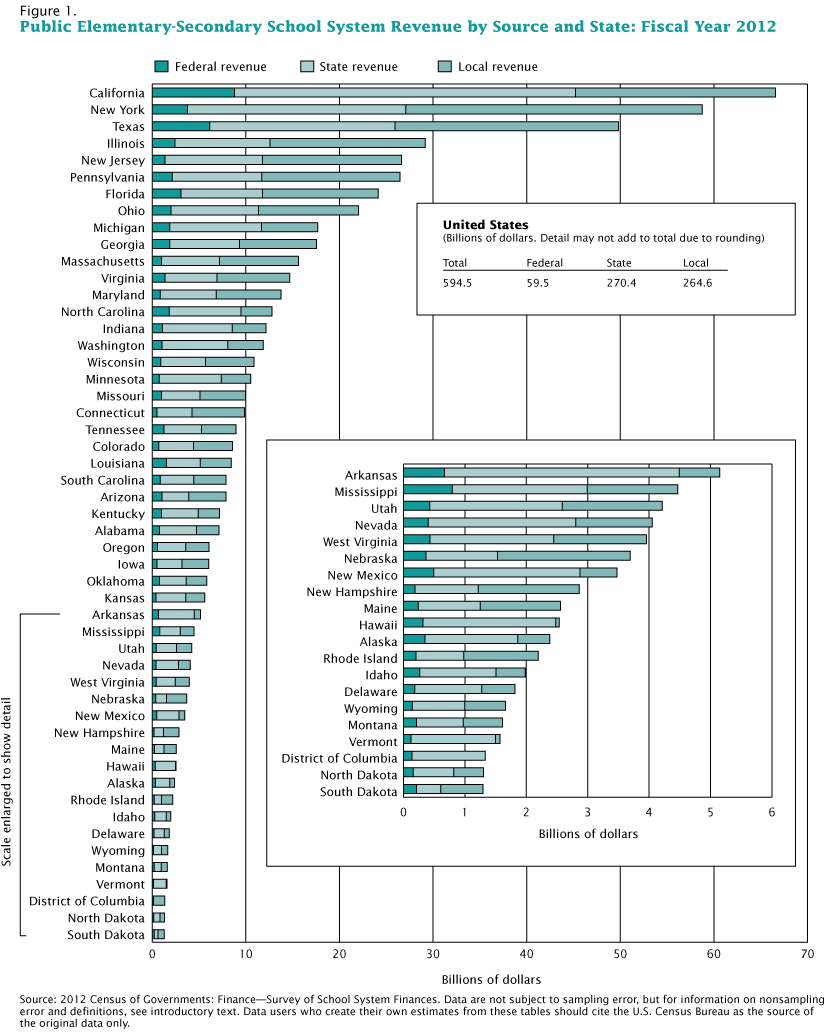
Educational systems around the world have many differences, though the same factors—including resources and money—affect every educational system. Educational distribution is a major issue in many nations, including in the United States, where the amount of money spent per student varies greatly by state. Education happens through both formal and informal systems; both foster cultural transmission. Universal access to education is a worldwide concern.

Short answer

Has there ever been a time when your formal and informal educations in the same setting were at odds? How did you overcome that disconnect?

Got questions? Get instant answers now!

Do you believe free access to schools has achieved its intended goal? Explain.

Got questions? Get instant answers now!

Further research

Though it’s a struggle, education is continually being improved in the developing world. To learn how educational programs are being fostered worldwide, explore the Education section of the Center for Global Development’s website: (External Link)

References

Darling-Hammond, Linda. 2010. "What We Can Learn from Finland's Successful School Reform." NEA Today Magazine. Retrieved December 12, 2014. ( (External Link) )..

Durkheim, Emile. 1898 [1956]. Education and Sociology . New York: Free Press.

Gross-Loh, Christine. 2014. "Finnish Education Chief: 'We Created a School System Based on Equality.'" The Atlantic. Retrieved December 12, 2014. ( (External Link) ).

Mills v. Board of Education , 348 DC 866 (1972).

National Center for Public Policy and Higher Education. 2006. Measuring UP: The National Report Card on Higher Education . Retrieved December 9, 2011 ( (External Link) ).

National Public Radio. 2010. “Study Confirms U.S. Falling Behind in Education.” All Things Considered , December 10. Retrieved December 9, 2011 ( (External Link) ).

Pellissier, Hank. 2010. “High Test Scores, Higher Expectations, and Presidential Hype.” Great Schools . Retrieved January 17, 2012 ( (External Link) ).

Rampell, Catherine. 2009. “Of All States, New York’s Schools Spend Most Money Per Pupil.” Economix . Retrieved December 15, 2011 ( (External Link) ).

U.S. Census Bureau. 2014. "Public Education Finances 2012." Retrieved December 12, 2014. ( (External Link) ).

World Bank. 2011. “Education in Afghanistan.” Retrieved December 14, 2011 ( (External Link) ).

Questions & Answers

differentiate between demand and supply giving examples
Lambiv Reply
differentiated between demand and supply using examples
Lambiv
what is labour ?
Lambiv
how will I do?
Venny Reply
how is the graph works?I don't fully understand
Rezat Reply
information
Eliyee
devaluation
Eliyee
t
WARKISA
hi guys good evening to all
Lambiv
multiple choice question
Aster Reply
appreciation
Eliyee
explain perfect market
Lindiwe Reply
In economics, a perfect market refers to a theoretical construct where all participants have perfect information, goods are homogenous, there are no barriers to entry or exit, and prices are determined solely by supply and demand. It's an idealized model used for analysis,
Ezea
What is ceteris paribus?
Shukri Reply
other things being equal
AI-Robot
When MP₁ becomes negative, TP start to decline. Extuples Suppose that the short-run production function of certain cut-flower firm is given by: Q=4KL-0.6K2 - 0.112 • Where is quantity of cut flower produced, I is labour input and K is fixed capital input (K-5). Determine the average product of lab
Kelo
Extuples Suppose that the short-run production function of certain cut-flower firm is given by: Q=4KL-0.6K2 - 0.112 • Where is quantity of cut flower produced, I is labour input and K is fixed capital input (K-5). Determine the average product of labour (APL) and marginal product of labour (MPL)
Kelo
yes,thank you
Shukri
Can I ask you other question?
Shukri
what is monopoly mean?
Habtamu Reply
What is different between quantity demand and demand?
Shukri Reply
Quantity demanded refers to the specific amount of a good or service that consumers are willing and able to purchase at a give price and within a specific time period. Demand, on the other hand, is a broader concept that encompasses the entire relationship between price and quantity demanded
Ezea
ok
Shukri
how do you save a country economic situation when it's falling apart
Lilia Reply
what is the difference between economic growth and development
Fiker Reply
Economic growth as an increase in the production and consumption of goods and services within an economy.but Economic development as a broader concept that encompasses not only economic growth but also social & human well being.
Shukri
production function means
Jabir
What do you think is more important to focus on when considering inequality ?
Abdisa Reply
any question about economics?
Awais Reply
sir...I just want to ask one question... Define the term contract curve? if you are free please help me to find this answer 🙏
Asui
it is a curve that we get after connecting the pareto optimal combinations of two consumers after their mutually beneficial trade offs
Awais
thank you so much 👍 sir
Asui
In economics, the contract curve refers to the set of points in an Edgeworth box diagram where both parties involved in a trade cannot be made better off without making one of them worse off. It represents the Pareto efficient allocations of goods between two individuals or entities, where neither p
Cornelius
In economics, the contract curve refers to the set of points in an Edgeworth box diagram where both parties involved in a trade cannot be made better off without making one of them worse off. It represents the Pareto efficient allocations of goods between two individuals or entities,
Cornelius
Suppose a consumer consuming two commodities X and Y has The following utility function u=X0.4 Y0.6. If the price of the X and Y are 2 and 3 respectively and income Constraint is birr 50. A,Calculate quantities of x and y which maximize utility. B,Calculate value of Lagrange multiplier. C,Calculate quantities of X and Y consumed with a given price. D,alculate optimum level of output .
Feyisa Reply
Answer
Feyisa
c
Jabir
the market for lemon has 10 potential consumers, each having an individual demand curve p=101-10Qi, where p is price in dollar's per cup and Qi is the number of cups demanded per week by the i th consumer.Find the market demand curve using algebra. Draw an individual demand curve and the market dema
Gsbwnw Reply
suppose the production function is given by ( L, K)=L¼K¾.assuming capital is fixed find APL and MPL. consider the following short run production function:Q=6L²-0.4L³ a) find the value of L that maximizes output b)find the value of L that maximizes marginal product
Abdureman
types of unemployment
Yomi Reply
What is the difference between perfect competition and monopolistic competition?
Mohammed
Got questions? Join the online conversation and get instant answers!
Jobilize.com Reply

Get Jobilize Job Search Mobile App in your pocket Now!

Get it on Google Play Download on the App Store Now


Source:  OpenStax, Introduction to sociology 2e. OpenStax CNX. Jan 20, 2016 Download for free at http://legacy.cnx.org/content/col11762/1.6
Google Play and the Google Play logo are trademarks of Google Inc.

Notification Switch

Would you like to follow the 'Introduction to sociology 2e' conversation and receive update notifications?

Ask