

| << Chapter < Page | Chapter >> Page > |
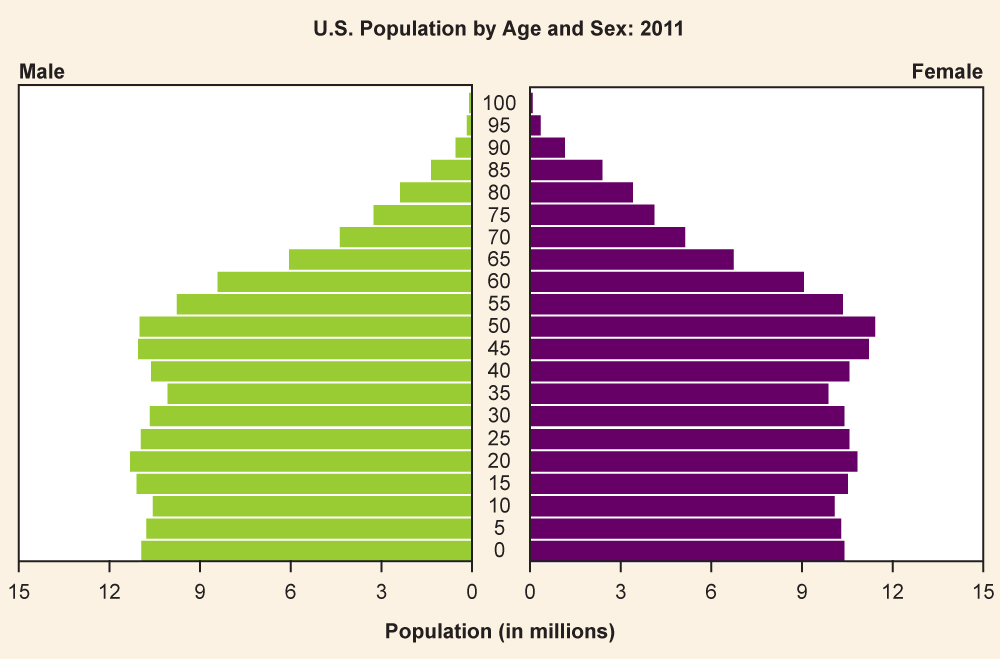
Changing fertility, mortality, and migration rates make up the total population composition , a snapshot of the demographic profile of a population. This number can be measured for societies, nations, world regions, or other groups. The population composition includes the sex ratio , the number of men for every hundred women, as well as the population pyramid , a picture of population distribution by sex and age ( [link] ).
| Country | Population (in millions) | Fertility Rate | Mortality Rate | Sex Ratio Male to Female |
|---|---|---|---|---|
| Afghanistan | 31.8 | 5.4% | 14.1% | 1.03 |
| Sweden | 9.7 | 1.9% | 9.6% | 0.98 |
| United States of America | 318.92 | 2.0% | 8.2% | 0.97 |
Comparing the three countries in [link] reveals that there are more men than women in Afghanistan, whereas the reverse is true in Sweden and the United States. Afghanistan also has significantly higher fertility and mortality rates than either of the other two countries. Do these statistics surprise you? How do you think the population makeup affects the political climate and economics of the different countries?
Sociologists have long looked at population issues as central to understanding human interactions. Below we will look at four theories about population that inform sociological thought: Malthusian, zero population growth, cornucopian, and demographic transition theories.
Thomas Malthus (1766–1834) was an English clergyman who made dire predictions about earth’s ability to sustain its growing population. According to Malthusian theory , three factors would control human population that exceeded the earth’s carrying capacity , or how many people can live in a given area considering the amount of available resources. Malthus identified these factors as war, famine, and disease (Malthus 1798). He termed them “positive checks” because they increase mortality rates, thus keeping the population in check. They are countered by “preventive checks,” which also control the population but by reducing fertility rates; preventive checks include birth control and celibacy. Thinking practically, Malthus saw that people could produce only so much food in a given year, yet the population was increasing at an exponential rate. Eventually, he thought people would run out of food and begin to starve. They would go to war over increasingly scarce resources and reduce the population to a manageable level, and then the cycle would begin anew.
Of course, this has not exactly happened. The human population has continued to grow long past Malthus’s predictions. So what happened? Why didn’t we die off? There are three reasons sociologists believe we are continuing to expand the population of our planet. First, technological increases in food production have increased both the amount and quality of calories we can produce per person. Second, human ingenuity has developed new medicine to curtail death from disease. Finally, the development and widespread use of contraception and other forms of family planning have decreased the speed at which our population increases. But what about the future? Some still believe Malthus was correct and that ample resources to support the earth’s population will soon run out.
Notification Switch
Would you like to follow the 'Introduction to sociology 2e' conversation and receive update notifications?

|
|
|
|
|

|
|

|
|

|
|

|
|

|
|

|
|

|
|
|
|
|
|
|
|

|