| << Chapter < Page | Chapter >> Page > |
As with specific phobias, it is highly probable that the fears inherent to social anxiety disorder can develop through conditioning experiences. For example, a child who is subjected to early unpleasant social experiences (e.g., bullying at school) may develop negative social images of herself that become activated later in anxiety-provoking situations (Hackmann, Clark,&McManus, 2000). Indeed, one study reported that 92% of a sample of adults with social anxiety disorder reported a history of severe teasing in childhood, compared to only 35% of a sample of adults with panic disorder (McCabe, Antony, Summerfeldt, Liss,&Swinson, 2003).
One of the most well-established risk factors for developing social anxiety disorder is behavioral inhibition (Clauss&Blackford, 2012). Behavioral inhibition is thought to be an inherited trait, and it is characterized by a consistent tendency to show fear and restraint when presented with unfamiliar people or situations (Kagan, Reznick,&Snidman, 1988). Behavioral inhibition is displayed very early in life; behaviorally inhibited toddlers and children respond with great caution and restraint in unfamiliar situations, and they are often timid, fearful, and shy around unfamiliar people (Fox, Henderson, Marshall, Nichols,&Ghera, 2005). A recent statistical review of studies demonstrated that behavioral inhibition was associated with more than a sevenfold increase in the risk of development of social anxiety disorder, demonstrating that behavioral inhibition is a major risk factor for the disorder (Clauss&Blackford, 2012).
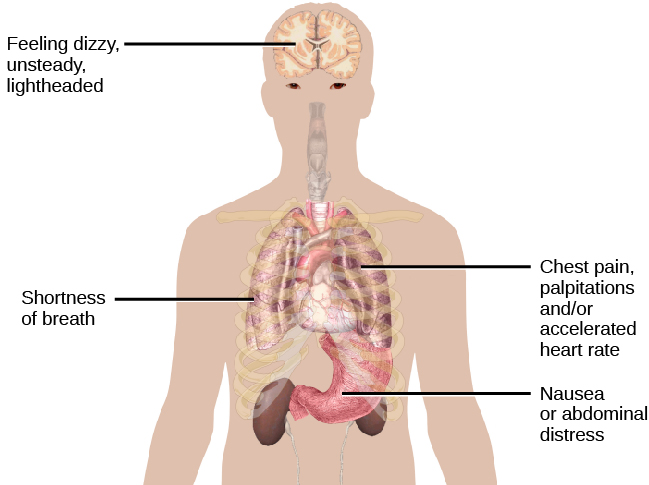
Imagine that you are at the mall one day with your friends and—suddenly and inexplicably—you begin sweating and trembling, your heart starts pounding, you have trouble breathing, and you start to feel dizzy and nauseous. This episode lasts for 10 minutes and is terrifying because you start to think that you are going to die. When you visit your doctor the following morning and describe what happened, she tells you that you have experienced a panic attack ( [link] ). If you experience another one of these episodes two weeks later and worry for a month or more that similar episodes will occur in the future, it is likely that you have developed panic disorder.

People with panic disorder experience recurrent (more than one) and unexpected panic attacks, along with at least one month of persistent concern about additional panic attacks, worry over the consequences of the attacks, or self-defeating changes in behavior related to the attacks (e.g., avoidance of exercise or unfamiliar situations) (APA, 2013). As is the case with other anxiety disorders, the panic attacks cannot result from the physiological effects of drugs and other substances, a medical condition, or another mental disorder. A panic attack is defined as a period of extreme fear or discomfort that develops abruptly and reaches a peak within 10 minutes. Its symptoms include accelerated heart rate, sweating, trembling, choking sensations, hot flashes or chills, dizziness or lightheadedness, fears of losing control or going crazy, and fears of dying (APA, 2013). Sometimes panic attacks are expected, occurring in response to specific environmental triggers (such as being in a tunnel); other times, these episodes are unexpected and emerge randomly (such as when relaxing). According to the DSM-5, the person must experience unexpected panic attacks to qualify for a diagnosis of panic disorder.

Notification Switch
Would you like to follow the 'Psychology' conversation and receive update notifications?