

| << Chapter < Page | Chapter >> Page > |
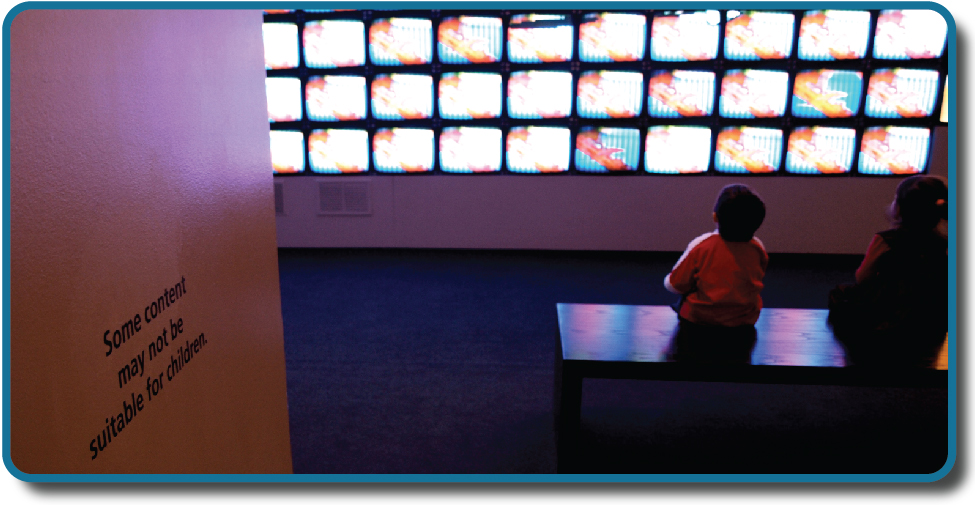
Have you ever wondered whether the violence you see on television affects your behavior? Are you more likely to behave aggressively in real life after watching people behave violently in dramatic situations on the screen? Or, could seeing fictional violence actually get aggression out of your system, causing you to be more peaceful? How are children influenced by the media they are exposed to? A psychologist interested in the relationship between behavior and exposure to violent images might ask these very questions.
The topic of violence in the media today is contentious. Since ancient times, humans have been concerned about the effects of new technologies on our behaviors and thinking processes. The Greek philosopher Socrates, for example, worried that writing—a new technology at that time—would diminish people’s ability to remember because they could rely on written records rather than committing information to memory. In our world of quickly changing technologies, questions about the effects of media continue to emerge. Many of us find ourselves with a strong opinion on these issues, only to find the person next to us bristling with the opposite view.
How can we go about finding answers that are supported not by mere opinion, but by evidence that we can all agree on? The findings of psychological research can help us navigate issues like this.
American Academy of Pediatrics, American Academy of Child&Adolescent Psychiatry, American Psychological Association, American Medical Association, American Academy of Family Physicians, American Psychiatric Association. (2000). Joint statement on the impact of entertainment violence on children . Retrieved from http://www2.aap.org/advocacy/releases/jstmtevc.htm.
American Cancer Society. (n.d.). History of the cancer prevention studies . Retrieved from http://www.cancer.org/research/researchtopreventcancer/history-cancer-prevention-study
American Psychological Association. (2009). Publication Manual of the American Psychological Association (6th ed.). Washington, DC: Author.
American Psychological Association. (n.d.). Research with animals in psychology. Retrieved from https://www.apa.org/research/responsible/research-animals.pdf
Arnett, J. (2008). The neglected 95%: Why American psychology needs to become less American. American Psychologist, 63 (7) , 602–614.
Barton, B. A., Eldridge, A. L., Thompson, D., Affenito, S. G., Striegel-Moore, R. H., Franko, D. L., . . . Crockett, S. J. (2005). The relationship of breakfast and cereal consumption to nutrient intake and body mass index: The national heart, lung, and blood institute growth and health study. Journal of the American Dietetic Association, 105 (9), 1383–1389. Retrieved from http://dx.doi.org/10.1016/j.jada.2005.06.003
Chwalisz, K., Diener, E.,&Gallagher, D. (1988). Autonomic arousal feedback and emotional experience: Evidence from the spinal cord injured. Journal of Personality and Social Psychology, 54 , 820–828.
Notification Switch
Would you like to follow the 'Psychology' conversation and receive update notifications?

|
|

|
|

|
|

|
|

|
|

|
|

|
|

|
|

|
|

|
|

|