Finding increasing and decreasing intervals on a graph
Given the function
in
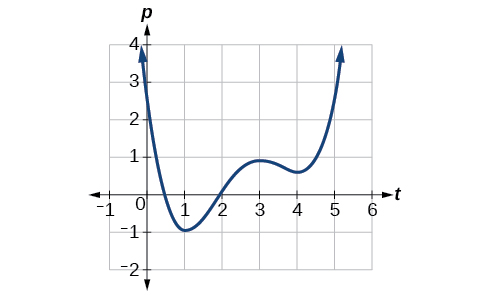
[link] , identify the intervals on which the function appears to be increasing.
We see that the function is not constant on any interval. The function is increasing where it slants upward as we move to the right and decreasing where it slants downward as we move to the right. The function appears to be increasing from
to
and from
on.
In
interval notation , we would say the function appears to be increasing on the interval (1,3) and the interval
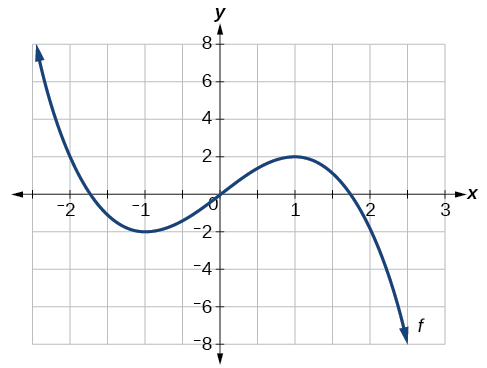
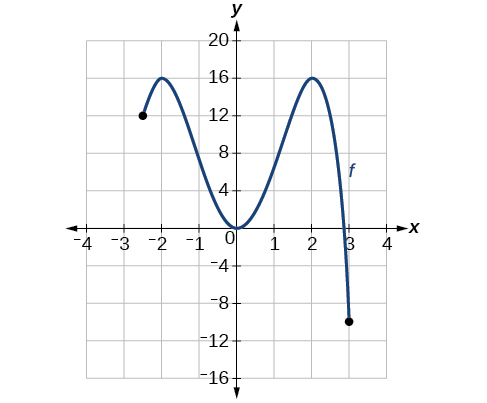
Graph the function
Then use the graph to estimate the local extrema of the function and to determine the intervals on which the function is increasing.
Using technology, we find that the graph of the function looks like that in
[link] . It appears there is a low point, or local minimum, between
and
and a mirror-image high point, or local maximum, somewhere between
and
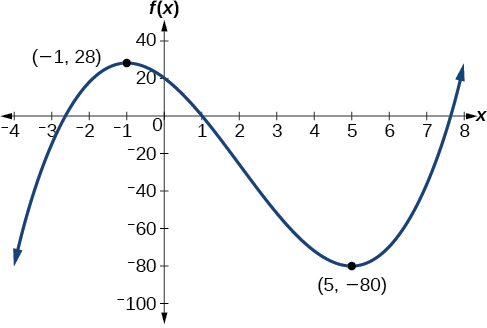
Graph the function
to estimate the local extrema of the function. Use these to determine the intervals on which the function is increasing and decreasing.
The local maximum appears to occur at
and the local minimum occurs at
The function is increasing on
and decreasing on
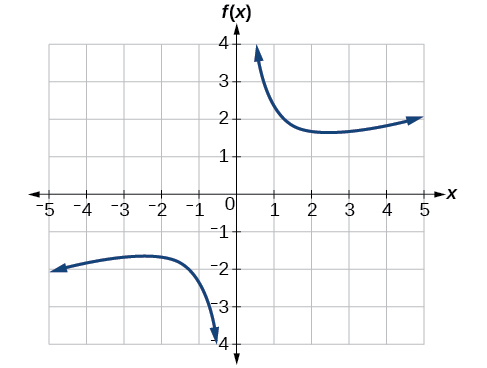
For the function
whose graph is shown in
[link] , find all local maxima and minima.
Observe the graph of
The graph attains a local maximum at
because it is the highest point in an open interval around
The local maximum is the
-coordinate at
which is
The graph attains a local minimum at
because it is the lowest point in an open interval around
The local minimum is the
y -coordinate at
which is
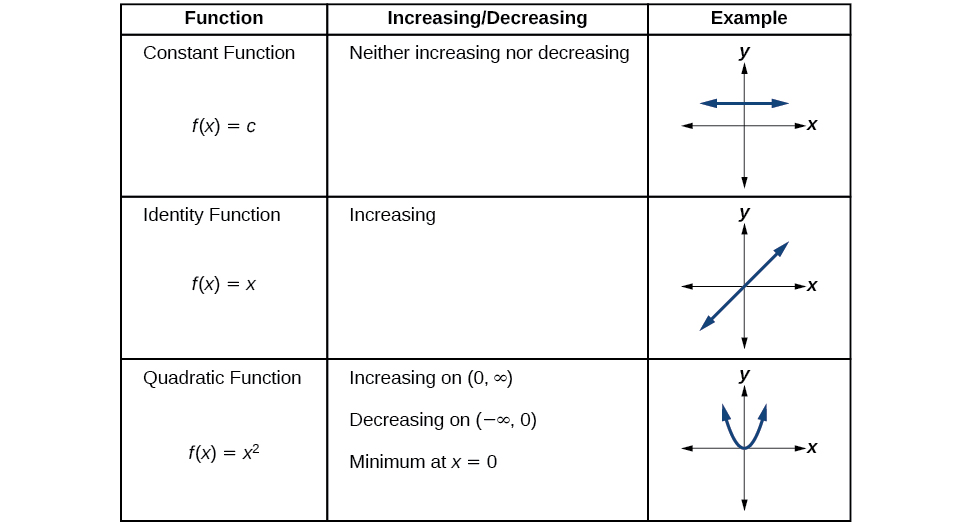
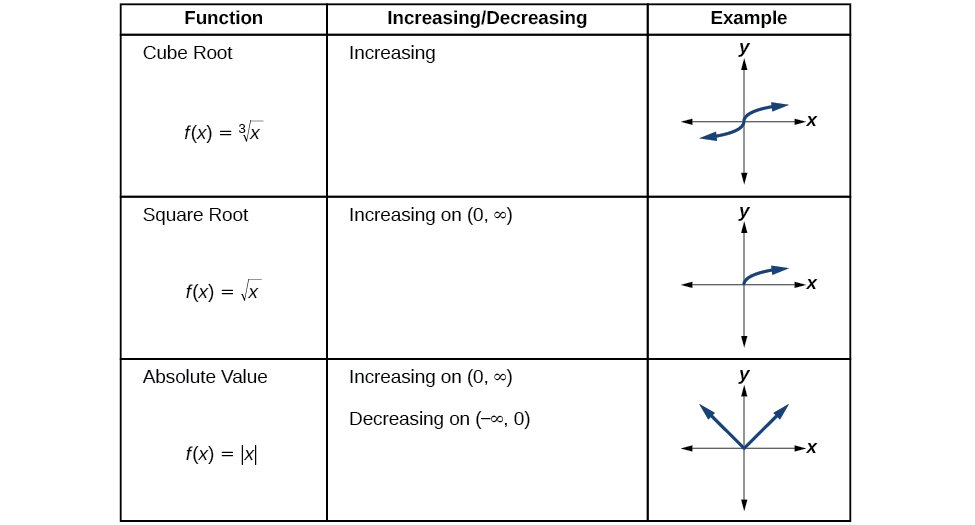
Analyzing the toolkit functions for increasing or decreasing intervals
We will now return to our toolkit functions and discuss their graphical behavior in
[link] ,
[link] , and
[link] .
Use a graph to locate the absolute maximum and absolute minimum
There is a difference between locating the highest and lowest points on a graph in a region around an open interval (locally) and locating the highest and lowest points on the graph for the entire domain. The
coordinates (output) at the highest and lowest points are called the
absolute maximum and
absolute minimum , respectively.
To locate absolute maxima and minima from a graph, we need to observe the graph to determine where the graph attains it highest and lowest points on the domain of the function. See
[link] .
Not every function has an absolute maximum or minimum value. The toolkit function
is one such function.
Absolute maxima and minima
The
absolute maximum of
at
is
where
for all
in the domain of
The
absolute minimum of
at
is
where
for all
in the domain of
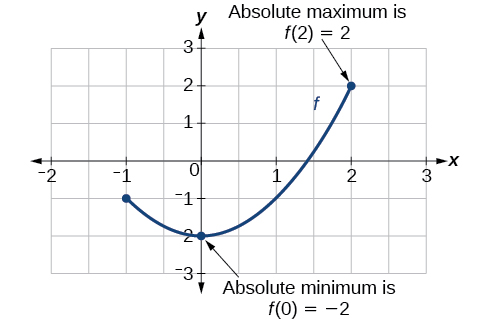
Finding absolute maxima and minima from a graph
For the function
shown in
[link] , find all absolute maxima and minima.
Observe the graph of
The graph attains an absolute maximum in two locations,
and
because at these locations, the graph attains its highest point on the domain of the function. The absolute maximum is the
y -coordinate at
and
which is
The graph attains an absolute minimum at
because it is the lowest point on the domain of the function’s graph. The absolute minimum is the
y -coordinate at
which is
A golfer on a fairway is 70 m away from the green, which sits below the level of the fairway by 20 m. If the golfer hits the ball at an angle of 40° with an initial speed of 20 m/s, how close to the green does she come?
A mouse of mass 200 g falls 100 m down a vertical mine shaft and lands at the bottom with a speed of 8.0 m/s. During its fall, how much work is done on the mouse by air resistance
Chemistry is a branch of science that deals with the study of matter,it composition,it structure and the changes it undergoes
Adjei
please, I'm a physics student and I need help in physics
Adjanou
chemistry could also be understood like the sexual attraction/repulsion of the male and female elements. the reaction varies depending on the energy differences of each given gender. + masculine -female.
Pedro
A ball is thrown straight up.it passes a 2.0m high window 7.50 m off the ground on it path up and takes 1.30 s to go past the window.what was the ball initial velocity
2. A sled plus passenger with total mass 50 kg is pulled 20 m across the snow (0.20) at constant velocity by a force directed 25° above the horizontal. Calculate (a) the work of the applied force, (b) the work of friction, and (c) the total work.
you have been hired as an espert witness in a court case involving an automobile accident. the accident involved car A of mass 1500kg which crashed into stationary car B of mass 1100kg. the driver of car A applied his brakes 15 m before he skidded and crashed into car B. after the collision, car A s
can someone explain to me, an ignorant high school student, why the trend of the graph doesn't follow the fact that the higher frequency a sound wave is, the more power it is, hence, making me think the phons output would follow this general trend?
Nevermind i just realied that the graph is the phons output for a person with normal hearing and not just the phons output of the sound waves power, I should read the entire thing next time
Joseph
Follow up question, does anyone know where I can find a graph that accuretly depicts the actual relative "power" output of sound over its frequency instead of just humans hearing
Joseph
"Generation of electrical energy from sound energy | IEEE Conference Publication | IEEE Xplore" ***ieeexplore.ieee.org/document/7150687?reload=true
A string is 3.00 m long with a mass of 5.00 g. The string is held taut with a tension of 500.00 N applied to the string. A pulse is sent down the string. How long does it take the pulse to travel the 3.00 m of the string?