<< Chapter < Page Chapter >> Page >

The limit of a function

A quantity L is the limit    of a function f ( x ) as x approaches a if, as the input values of x approach a (but do not equal a ) , the corresponding output values of f ( x ) get closer to L . Note that the value of the limit is not affected by the output value of f ( x ) at a . Both a and L must be real numbers. We write it as

lim x a f ( x ) = L

Understanding the limit of a function

For the following limit, define a , f ( x ) , and L .

lim x 2 ( 3 x + 5 ) = 11

First, we recognize the notation of a limit. If the limit exists, as x approaches a , we write

lim x a f ( x ) = L .

We are given

lim x 2 ( 3 x + 5 ) = 11.

This means that a = 2 , f ( x ) = 3 x + 5 ,  and  L = 11.

Got questions? Get instant answers now!

For the following limit, define a , f ( x ) , and L .

lim x 5 ( 2 x 2 4 ) = 46

a = 5 , f ( x ) = 2 x 2 4 , and L = 46.

Got questions? Get instant answers now!

Understanding left-hand limits and right-hand limits

We can approach the input of a function from either side of a value—from the left or the right. [link] shows the values of

f ( x ) = x + 1 , x 7

as described earlier and depicted in [link] .

Table showing that f(x) approaches 8 from either side as x approaches 7 from either side.

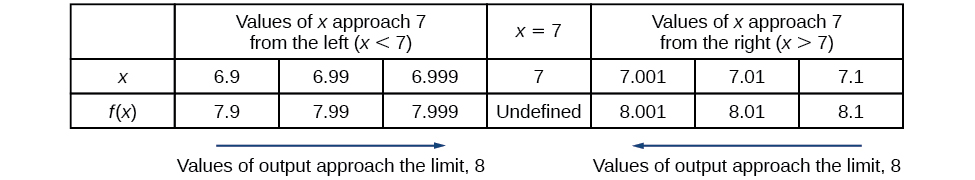
Values described as “from the left” are less than the input value 7 and would therefore appear to the left of the value on a number line. The input values that approach 7 from the left in [link] are 6.9 , 6.99 , and 6.999. The corresponding outputs are 7.9 , 7.99 , and 7.999. These values are getting closer to 8. The limit of values of f ( x ) as x approaches from the left is known as the left-hand limit. For this function, 8 is the left-hand limit of the function f ( x ) = x + 1 , x 7 as x approaches 7.

Values described as “from the right” are greater than the input value 7 and would therefore appear to the right of the value on a number line. The input values that approach 7 from the right in [link] are 7.1 , 7.01 , and 7.001. The corresponding outputs are 8.1 , 8.01 , and 8.001. These values are getting closer to 8. The limit of values of f ( x ) as x approaches from the right is known as the right-hand limit. For this function, 8 is also the right-hand limit of the function f ( x ) = x + 1 , x 7 as x approaches 7.

[link] shows that we can get the output of the function within a distance of 0.1 from 8 by using an input within a distance of 0.1 from 7. In other words, we need an input x within the interval 6.9 < x < 7.1 to produce an output value of f ( x ) within the interval 7.9 < f ( x ) < 8.1.

We also see that we can get output values of f ( x ) successively closer to 8 by selecting input values closer to 7. In fact, we can obtain output values within any specified interval if we choose appropriate input values.

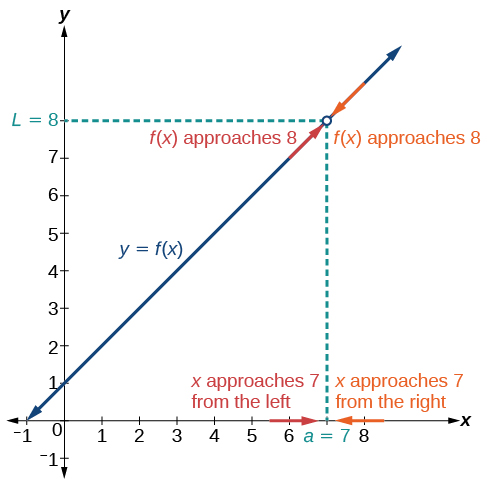
[link] provides a visual representation of the left- and right-hand limits of the function. From the graph of f ( x ) , we observe the output can get infinitesimally close to L = 8 as x approaches 7 from the left and as x approaches 7 from the right.

To indicate the left-hand limit, we write

lim x 7 f ( x ) = 8.

To indicate the right-hand limit, we write

lim x 7 + f ( x ) = 8.
Graph of the previous function explaining the function's limit at (7, 8)
The left- and right-hand limits are the same for this function.

Left- and right-hand limits

The left-hand limit    of a function f ( x ) as x approaches a from the left is equal to L , denoted by

lim x a f ( x ) = L .

The values of f ( x ) can get as close to the limit L as we like by taking values of x sufficiently close to a such that x < a and x a .

The right-hand limit    of a function f ( x ) , as x approaches a from the right, is equal to L , denoted by

lim x a + f ( x ) = L .

The values of f ( x ) can get as close to the limit L as we like by taking values of x sufficiently close to a but greater than a . Both a and L are real numbers.

Questions & Answers

how do you get the 2/50
Abba Reply
number of sport play by 50 student construct discrete data
Aminu Reply
width of the frangebany leaves on how to write a introduction
Theresa Reply
Solve the mean of variance
Veronica Reply
Step 1: Find the mean. To find the mean, add up all the scores, then divide them by the number of scores. ... Step 2: Find each score's deviation from the mean. ... Step 3: Square each deviation from the mean. ... Step 4: Find the sum of squares. ... Step 5: Divide the sum of squares by n – 1 or N.
kenneth
what is error
Yakuba Reply
Is mistake done to something
Vutshila
Hy
anas
hy
What is the life teble
anas
hy
Jibrin
statistics is the analyzing of data
Tajudeen Reply
what is statics?
Zelalem Reply
how do you calculate mean
Gloria Reply
diveving the sum if all values
Shaynaynay
let A1,A2 and A3 events be independent,show that (A1)^c, (A2)^c and (A3)^c are independent?
Fisaye Reply
what is statistics
Akhisani Reply
data collected all over the world
Shaynaynay
construct a less than and more than table
Imad Reply
The sample of 16 students is taken. The average age in the sample was 22 years with astandard deviation of 6 years. Construct a 95% confidence interval for the age of the population.
Aschalew Reply
Bhartdarshan' is an internet-based travel agency wherein customer can see videos of the cities they plant to visit. The number of hits daily is a normally distributed random variable with a mean of 10,000 and a standard deviation of 2,400 a. what is the probability of getting more than 12,000 hits? b. what is the probability of getting fewer than 9,000 hits?
Akshay Reply
Bhartdarshan'is an internet-based travel agency wherein customer can see videos of the cities they plan to visit. The number of hits daily is a normally distributed random variable with a mean of 10,000 and a standard deviation of 2,400. a. What is the probability of getting more than 12,000 hits
Akshay
1
Bright
Sorry i want to learn more about this question
Bright
Someone help
Bright
a= 0.20233 b=0.3384
Sufiyan
a
Shaynaynay
How do I interpret level of significance?
Mohd Reply
It depends on your business problem or in Machine Learning you could use ROC- AUC cruve to decide the threshold value
Shivam
how skewness and kurtosis are used in statistics
Owen Reply
yes what is it
Taneeya
Got questions? Join the online conversation and get instant answers!
Jobilize.com Reply
Practice Key Terms 4

Get Jobilize Job Search Mobile App in your pocket Now!

Get it on Google Play Download on the App Store Now


Source:  OpenStax, Precalculus. OpenStax CNX. Jan 19, 2016 Download for free at https://legacy.cnx.org/content/col11667/1.6
Google Play and the Google Play logo are trademarks of Google Inc.

Notification Switch

Would you like to follow the 'Precalculus' conversation and receive update notifications?

Ask