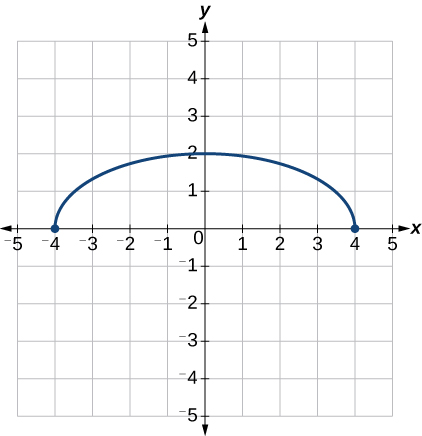
To simplify, let’s start by factoring out the inside of the function.
By factoring the inside, we can first horizontally stretch by 2, as indicated by the
on the inside of the function. Remember that twice the size of 0 is still 0, so the point (0,2) remains at (0,2) while the point (2,0) will stretch to (4,0). See
[link] .
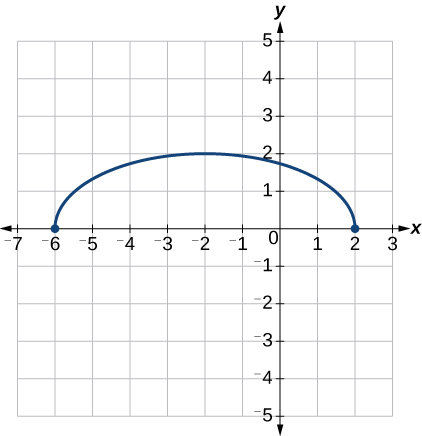
Next, we horizontally shift left by 2 units, as indicated by
See
[link] .
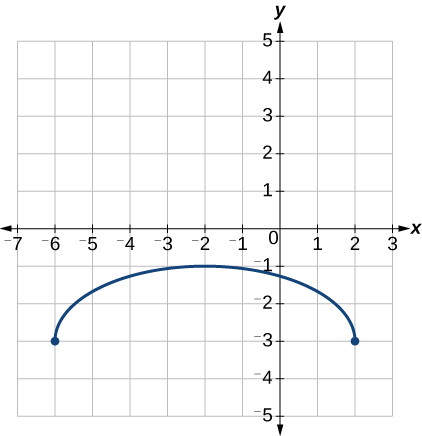
Last, we vertically shift down by 3 to complete our sketch, as indicated by the
on the outside of the function. See
[link] .
A function can be shifted vertically by adding a constant to the output. See
[link] and
[link] .
A function can be shifted horizontally by adding a constant to the input. See
[link] ,
[link] , and
[link] .
Relating the shift to the context of a problem makes it possible to compare and interpret vertical and horizontal shifts. See
[link] .
Vertical and horizontal shifts are often combined. See
[link] and
[link] .
A vertical reflection reflects a graph about the
axis. A graph can be reflected vertically by multiplying the output by –1.
A horizontal reflection reflects a graph about the
axis. A graph can be reflected horizontally by multiplying the input by –1.
A graph can be reflected both vertically and horizontally. The order in which the reflections are applied does not affect the final graph. See
[link] .
A function presented in tabular form can also be reflected by multiplying the values in the input and output rows or columns accordingly. See
[link] .
A function presented as an equation can be reflected by applying transformations one at a time. See
[link] .
Even functions are symmetric about the
axis, whereas odd functions are symmetric about the origin.
Even functions satisfy the condition
Odd functions satisfy the condition
A function can be odd, even, or neither. See
[link] .
A function can be compressed or stretched vertically by multiplying the output by a constant. See
[link] ,
[link] , and
[link] .
A function can be compressed or stretched horizontally by multiplying the input by a constant. See
[link] ,
[link] , and
[link] .
The order in which different transformations are applied does affect the final function. Both vertical and horizontal transformations must be applied in the order given. However, a vertical transformation may be combined with a horizontal transformation in any order. See
[link] and
[link] .
Section exercises
Verbal
When examining the formula of a function that is the result of multiple transformations, how can you tell a horizontal shift from a vertical shift?
A horizontal shift results when a constant is added to or subtracted from the input. A vertical shifts results when a constant is added to or subtracted from the output.
Step 1: Find the mean. To find the mean, add up all the scores, then divide them by the number of scores. ...
Step 2: Find each score's deviation from the mean. ...
Step 3: Square each deviation from the mean. ...
Step 4: Find the sum of squares. ...
Step 5: Divide the sum of squares by n – 1 or N.
The sample of 16 students is taken. The average age in the sample was 22 years with astandard deviation of 6 years. Construct a 95% confidence interval for the age of the population.
Bhartdarshan' is an internet-based travel agency wherein customer can see videos of the cities they plant to visit. The number of hits daily is a normally distributed random variable with a mean of 10,000 and a standard deviation of 2,400
a. what is the probability of getting more than 12,000 hits?
b. what is the probability of getting fewer than 9,000 hits?
Bhartdarshan'is an internet-based travel agency wherein customer can see videos of the cities they plan to visit. The number of hits daily is a normally distributed random variable with a mean of 10,000 and a standard deviation of 2,400.
a. What is the probability of getting more than 12,000 hits