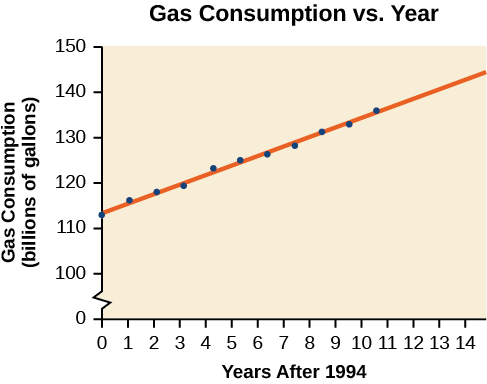
Gasoline consumption in the United States has been steadily increasing. Consumption data from 1994 to 2004 is shown in
[link]http://www.bts.gov/publications/national_transportation_statistics/2005/html/table_04_10.html . Determine whether the trend is linear, and if so, find a model for the data. Use the model to predict the consumption in 2008.
Year
'94
'95
'96
'97
'98
'99
'00
'01
'02
'03
'04
Consumption (billions of gallons)
113
116
118
119
123
125
126
128
131
133
136
The scatter plot of the data, including the least squares regression line, is shown in
[link] .
We can introduce new input variable,
representing years since 1994.
The least squares regression equation is:
Using technology, the correlation coefficient was calculated to be 0.9965, suggesting a very strong increasing linear trend.
Using this to predict consumption in 2008
The model predicts 144.244 billion gallons of gasoline consumption in 2008.
Visit
this website for additional practice questions from Learningpod.
Key concepts
Scatter plots show the relationship between two sets of data. See
[link] .
Scatter plots may represent linear or non-linear models.
The line of best fit may be estimated or calculated, using a calculator or statistical software. See
[link] .
Interpolation can be used to predict values inside the domain and range of the data, whereas extrapolation can be used to predict values outside the domain and range of the data. See
[link] .
The correlation coefficient,
indicates the degree of linear relationship between data. See
[link] .
A regression line best fits the data. See
[link] .
The least squares regression line is found by minimizing the squares of the distances of points from a line passing through the data and may be used to make predictions regarding either of the variables. See
[link] .
Section exercises
Verbal
Describe what it means if there is a model breakdown when using a linear model.
When our model no longer applies, after some value in the domain, the model itself doesn’t hold.
A regression was run to determine whether there is a relationship between hours of TV watched per day
and number of sit-ups a person can do
The results of the regression are given below. Use this to predict the number of sit-ups a person who watches 11 hours of TV can do.
the transfer of energy by a force that causes an object to be displaced; the product of the component of the force in the direction of the displacement and the magnitude of the displacement
A wave is described by the function D(x,t)=(1.6cm) sin[(1.2cm^-1(x+6.8cm/st] what are:a.Amplitude b. wavelength c. wave number d. frequency e. period f. velocity of speed.
A body is projected upward at an angle 45° 18minutes with the horizontal with an initial speed of 40km per second. In hoe many seconds will the body reach the ground then how far from the point of projection will it strike. At what angle will the horizontal will strike
Suppose hydrogen and oxygen are diffusing through air. A small amount of each is released simultaneously. How much time passes before the hydrogen is 1.00 s ahead of the oxygen? Such differences in arrival times are used as an analytical tool in gas chromatography.
the science concerned with describing the interactions of energy, matter, space, and time; it is especially interested in what fundamental mechanisms underlie every phenomenon