<< Chapter < Page Chapter >> Page >

Formulas for a cardioid

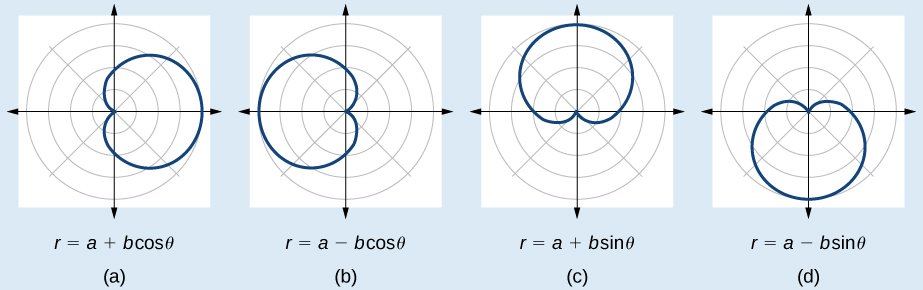
The formulas that produce the graphs of a cardioid    are given by r = a ± b cos θ and r = a ± b sin θ where a > 0 , b > 0 , and a b = 1. The cardioid graph passes through the pole, as we can see in [link] .

Graph of four cardioids. (A) is r = a + bcos(theta). Cardioid extending to the right. (B) is r=a-bcos(theta). Cardioid extending to the left. (C) is r=a+bsin(theta). Cardioid extending up. (D) is r=a-bsin(theta). Cardioid extending down.

Given the polar equation of a cardioid, sketch its graph.
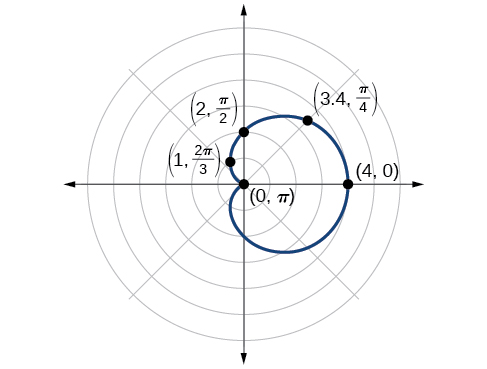
  1. Check equation for the three types of symmetry.
  2. Find the zeros. Set r = 0.
  3. Find the maximum value of the equation according to the maximum value of the trigonometric expression.
  4. Make a table of values for r and θ .
  5. Plot the points and sketch the graph.

Sketching the graph of a cardioid

Sketch the graph of r = 2 + 2 cos θ .

First, testing the equation for symmetry, we find that the graph of this equation will be symmetric about the polar axis. Next, we find the zeros and maximums. Setting r = 0 , we have θ = π + 2 k π . The zero of the equation is located at ( 0 , π ) . The graph passes through this point.

The maximum value of r = 2 + 2 cos θ occurs when cos θ is a maximum, which is when cos θ = 1 or when θ = 0. Substitute θ = 0 into the equation, and solve for r .

r = 2 + 2 cos ( 0 ) r = 2 + 2 ( 1 ) = 4

The point ( 4 , 0 ) is the maximum value on the graph.

We found that the polar equation is symmetric with respect to the polar axis, but as it extends to all four quadrants, we need to plot values over the interval [ 0 , π ] . The upper portion of the graph is then reflected over the polar axis. Next, we make a table of values, as in [link] , and then we plot the points and draw the graph. See [link] .

θ 0 π 4 π 2 2 π 3 π
r 4 3.41 2 1 0
Graph of r=2+2cos(theta). Cardioid extending to the right. Points on the edge (0,pi), (4,0),(3.4, pi/4), (2,pi/2), and (1, 2pi/3) are shown.
Got questions? Get instant answers now!

Investigating limaçons

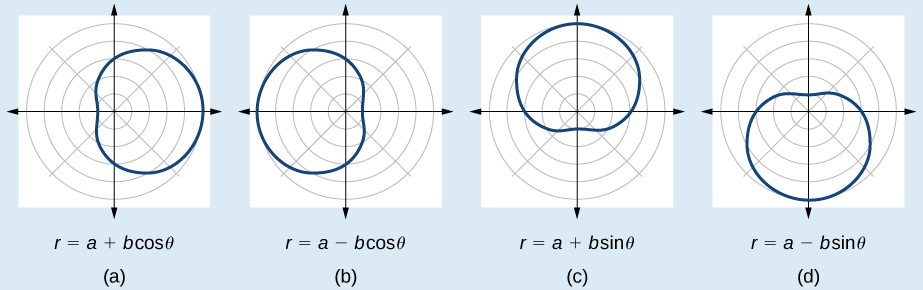
The word limaçon is Old French for “snail,” a name that describes the shape of the graph. As mentioned earlier, the cardioid is a member of the limaçon family, and we can see the similarities in the graphs. The other images in this category include the one-loop limaçon and the two-loop (or inner-loop) limaçon. One-loop limaçons are sometimes referred to as dimpled limaçons when 1 < a b < 2 and convex limaçons when a b 2.

Formulas for one-loop limaçons

The formulas that produce the graph of a dimpled one-loop limaçon are given by r = a ± b cos θ and r = a ± b sin θ where a > 0 , b > 0 , and 1< a b < 2. All four graphs are shown in [link] .

Four dimpled limaçons side by side. (A) is r=a+bcos(theta). Extending to the right. (B) is r=a-bcos(theta). Extending to the left. (C) is r=a+bsin(theta). Extending up. (D) is r=a-bsin(theta). Extending down.
Dimpled limaçons

Given a polar equation for a one-loop limaçon, sketch the graph.
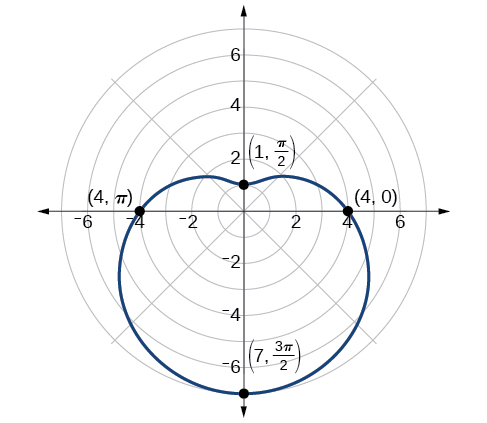
  1. Test the equation for symmetry. Remember that failing a symmetry test does not mean that the shape will not exhibit symmetry. Often the symmetry may reveal itself when the points are plotted.
  2. Find the zeros.
  3. Find the maximum values according to the trigonometric expression.
  4. Make a table.
  5. Plot the points and sketch the graph.

Sketching the graph of a one-loop limaçon

Graph the equation r = 4 3 sin θ .

First, testing the equation for symmetry, we find that it fails all three symmetry tests, meaning that the graph may or may not exhibit symmetry, so we cannot use the symmetry to help us graph it. However, this equation has a graph that clearly displays symmetry with respect to the line θ = π 2 , yet it fails all the three symmetry tests. A graphing calculator will immediately illustrate the graph’s reflective quality.

Next, we find the zeros and maximum, and plot the reflecting points to verify any symmetry. Setting r = 0 results in θ being undefined. What does this mean? How could θ be undefined? The angle θ is undefined for any value of sin θ > 1. Therefore, θ is undefined because there is no value of θ for which sin θ > 1. Consequently, the graph does not pass through the pole. Perhaps the graph does cross the polar axis, but not at the pole. We can investigate other intercepts by calculating r when θ = 0.

r ( 0 ) = 4 3 sin ( 0 ) r = 4 3 0 = 4

So, there is at least one polar axis intercept at ( 4 , 0 ) .

Next, as the maximum value of the sine function is 1 when θ = π 2 , we will substitute θ = π 2 into the equation and solve for r . Thus, r = 1.

Make a table of the coordinates similar to [link] .

θ 0 π 6 π 3 π 2 2 π 3 5 π 6 π 7 π 6 4 π 3 3 π 2 5 π 3 11 π 6 2 π
r 4 2.5 1.4 1 1.4 2.5 4 5.5 6.6 7 6.6 5.5 4

The graph is shown in [link] .

Graph of the limaçon r=4-3sin(theta). Extending down. Points on the edge are shown: (1,pi/2), (4,0), (4,pi), and (7, 3pi/2).
One-loop limaçon
Got questions? Get instant answers now!

Questions & Answers

Ayele, K., 2003. Introductory Economics, 3rd ed., Addis Ababa.
Widad Reply
can you send the book attached ?
Ariel
?
Ariel
What is economics
Widad Reply
the study of how humans make choices under conditions of scarcity
AI-Robot
U(x,y) = (x×y)1/2 find mu of x for y
Desalegn Reply
U(x,y) = (x×y)1/2 find mu of x for y
Desalegn
what is ecnomics
Jan Reply
this is the study of how the society manages it's scarce resources
Belonwu
what is macroeconomic
John Reply
macroeconomic is the branch of economics which studies actions, scale, activities and behaviour of the aggregate economy as a whole.
husaini
etc
husaini
difference between firm and industry
husaini Reply
what's the difference between a firm and an industry
Abdul
firm is the unit which transform inputs to output where as industry contain combination of firms with similar production 😅😅
Abdulraufu
Suppose the demand function that a firm faces shifted from Qd  120 3P to Qd  90  3P and the supply function has shifted from QS  20  2P to QS 10  2P . a) Find the effect of this change on price and quantity. b) Which of the changes in demand and supply is higher?
Toofiq Reply
explain standard reason why economic is a science
innocent Reply
factors influencing supply
Petrus Reply
what is economic.
Milan Reply
scares means__________________ends resources. unlimited
Jan
economics is a science that studies human behaviour as a relationship b/w ends and scares means which have alternative uses
Jan
calculate the profit maximizing for demand and supply
Zarshad Reply
Why qualify 28 supplies
Milan
what are explicit costs
Nomsa Reply
out-of-pocket costs for a firm, for example, payments for wages and salaries, rent, or materials
AI-Robot
concepts of supply in microeconomics
David Reply
economic overview notes
Amahle Reply
identify a demand and a supply curve
Salome Reply
i don't know
Parul
there's a difference
Aryan
Demand curve shows that how supply and others conditions affect on demand of a particular thing and what percent demand increase whith increase of supply of goods
Israr
Hi Sir please how do u calculate Cross elastic demand and income elastic demand?
Abari
Got questions? Join the online conversation and get instant answers!
Jobilize.com Reply
Practice Key Terms 9

Get Jobilize Job Search Mobile App in your pocket Now!

Get it on Google Play Download on the App Store Now


Source:  OpenStax, Precalculus. OpenStax CNX. Jan 19, 2016 Download for free at https://legacy.cnx.org/content/col11667/1.6
Google Play and the Google Play logo are trademarks of Google Inc.

Notification Switch

Would you like to follow the 'Precalculus' conversation and receive update notifications?

Ask