<< Chapter < Page Chapter >> Page >
In this section, you will:
  • Graph functions using vertical and horizontal shifts.
  • Graph functions using reflections about the x -axis and the y -axis.
  • Determine whether a function is even, odd, or neither from its graph.
  • Graph functions using compressions and stretches.
  • Combine transformations.
Figure_01_05_038
(credit: "Misko"/Flickr)

We all know that a flat mirror enables us to see an accurate image of ourselves and whatever is behind us. When we tilt the mirror, the images we see may shift horizontally or vertically. But what happens when we bend a flexible mirror? Like a carnival funhouse mirror, it presents us with a distorted image of ourselves, stretched or compressed horizontally or vertically. In a similar way, we can distort or transform mathematical functions to better adapt them to describing objects or processes in the real world. In this section, we will take a look at several kinds of transformations.

Graphing functions using vertical and horizontal shifts

Often when given a problem, we try to model the scenario using mathematics in the form of words, tables, graphs, and equations. One method we can employ is to adapt the basic graphs of the toolkit functions to build new models for a given scenario. There are systematic ways to alter functions to construct appropriate models for the problems we are trying to solve.

Identifying vertical shifts

One simple kind of transformation involves shifting the entire graph of a function up, down, right, or left. The simplest shift is a vertical shift , moving the graph up or down, because this transformation involves adding a positive or negative constant to the function. In other words, we add the same constant to the output value of the function regardless of the input. For a function g ( x ) = f ( x ) + k , the function f ( x ) is shifted vertically k units. See [link] for an example.

Figure_01_05_001
Vertical shift by k = 1 of the cube root function f ( x ) = x 3 .

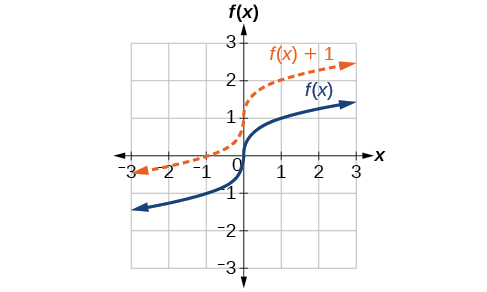
To help you visualize the concept of a vertical shift, consider that y = f ( x ) . Therefore, f ( x ) + k is equivalent to y + k . Every unit of y is replaced by y + k , so the y - value increases or decreases depending on the value of k . The result is a shift upward or downward.

Vertical shift

Given a function f ( x ) , a new function g ( x ) = f ( x ) + k , where k is a constant, is a vertical shift    of the function f ( x ) . All the output values change by k units. If k is positive, the graph will shift up. If k is negative, the graph will shift down.

Adding a constant to a function

To regulate temperature in a green building, airflow vents near the roof open and close throughout the day. [link] shows the area of open vents V (in square feet) throughout the day in hours after midnight, t . During the summer, the facilities manager decides to try to better regulate temperature by increasing the amount of open vents by 20 square feet throughout the day and night. Sketch a graph of this new function.

Figure_01_05_002

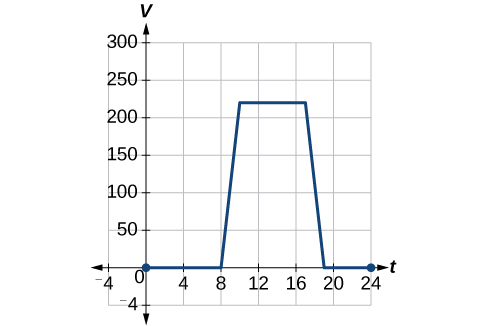
We can sketch a graph of this new function by adding 20 to each of the output values of the original function. This will have the effect of shifting the graph vertically up, as shown in [link] .

Figure_01_05_003a

Notice that in [link] , for each input value, the output value has increased by 20, so if we call the new function S ( t ) , we could write

S ( t ) = V ( t ) + 20

This notation tells us that, for any value of t , S ( t ) can be found by evaluating the function V at the same input and then adding 20 to the result. This defines S as a transformation of the function V , in this case a vertical shift up 20 units. Notice that, with a vertical shift, the input values stay the same and only the output values change. See [link] .

t 0 8 10 17 19 24
V ( t ) 0 0 220 220 0 0
S ( t ) 20 20 240 240 20 20
Got questions? Get instant answers now!

Questions & Answers

how do you get the 2/50
Abba Reply
number of sport play by 50 student construct discrete data
Aminu Reply
width of the frangebany leaves on how to write a introduction
Theresa Reply
Solve the mean of variance
Veronica Reply
Step 1: Find the mean. To find the mean, add up all the scores, then divide them by the number of scores. ... Step 2: Find each score's deviation from the mean. ... Step 3: Square each deviation from the mean. ... Step 4: Find the sum of squares. ... Step 5: Divide the sum of squares by n – 1 or N.
kenneth
what is error
Yakuba Reply
Is mistake done to something
Vutshila
Hy
anas
hy
What is the life teble
anas
hy
Jibrin
statistics is the analyzing of data
Tajudeen Reply
what is statics?
Zelalem Reply
how do you calculate mean
Gloria Reply
diveving the sum if all values
Shaynaynay
let A1,A2 and A3 events be independent,show that (A1)^c, (A2)^c and (A3)^c are independent?
Fisaye Reply
what is statistics
Akhisani Reply
data collected all over the world
Shaynaynay
construct a less than and more than table
Imad Reply
The sample of 16 students is taken. The average age in the sample was 22 years with astandard deviation of 6 years. Construct a 95% confidence interval for the age of the population.
Aschalew Reply
Bhartdarshan' is an internet-based travel agency wherein customer can see videos of the cities they plant to visit. The number of hits daily is a normally distributed random variable with a mean of 10,000 and a standard deviation of 2,400 a. what is the probability of getting more than 12,000 hits? b. what is the probability of getting fewer than 9,000 hits?
Akshay Reply
Bhartdarshan'is an internet-based travel agency wherein customer can see videos of the cities they plan to visit. The number of hits daily is a normally distributed random variable with a mean of 10,000 and a standard deviation of 2,400. a. What is the probability of getting more than 12,000 hits
Akshay
1
Bright
Sorry i want to learn more about this question
Bright
Someone help
Bright
a= 0.20233 b=0.3384
Sufiyan
a
Shaynaynay
How do I interpret level of significance?
Mohd Reply
It depends on your business problem or in Machine Learning you could use ROC- AUC cruve to decide the threshold value
Shivam
how skewness and kurtosis are used in statistics
Owen Reply
yes what is it
Taneeya
Got questions? Join the online conversation and get instant answers!
Jobilize.com Reply

Get Jobilize Job Search Mobile App in your pocket Now!

Get it on Google Play Download on the App Store Now


Source:  OpenStax, Precalculus. OpenStax CNX. Jan 19, 2016 Download for free at https://legacy.cnx.org/content/col11667/1.6
Google Play and the Google Play logo are trademarks of Google Inc.

Notification Switch

Would you like to follow the 'Precalculus' conversation and receive update notifications?

Ask