

| << Chapter < Page | Chapter >> Page > |
So how can we decide if a function is continuous at a particular number? We can check three different conditions. Let’s use the function represented in [link] as an example.
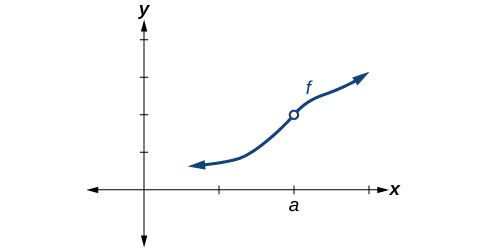
Condition 1 According to Condition 1, the function defined at must exist. In other words, there is a y -coordinate at as in [link] .
Condition 2 According to Condition 2, at the limit, written must exist. This means that at the left-hand limit must equal the right-hand limit. Notice as the graph of in [link] approaches from the left and right, the same y -coordinate is approached. Therefore, Condition 2 is satisfied. However, there could still be a hole in the graph at .
Condition 3 According to Condition 3, the corresponding coordinate at fills in the hole in the graph of This is written
Satisfying all three conditions means that the function is continuous. All three conditions are satisfied for the function represented in [link] so the function is continuous as

[link] through [link] provide several examples of graphs of functions that are not continuous at and the condition or conditions that fail.


A function is continuous at provided all three of the following conditions hold true:
If a function is not continuous at the function is discontinuous at .
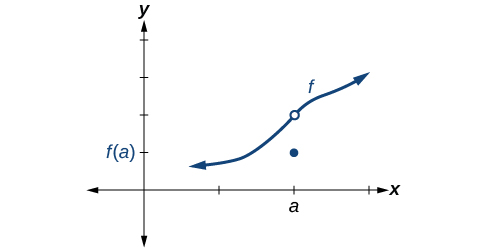
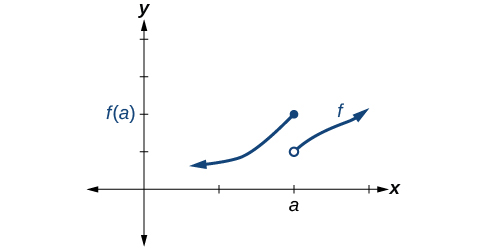
Discontinuity can occur in different ways. We saw in the previous section that a function could have a left-hand limit and a right-hand limit even if they are not equal. If the left- and right-hand limits exist but are different, the graph “jumps” at . The function is said to have a jump discontinuity.
As an example, look at the graph of the function in [link] . Notice as approaches how the output approaches different values from the left and from the right.

A function has a jump discontinuity at if the left- and right-hand limits both exist but are not equal: .
Some functions have a discontinuity, but it is possible to redefine the function at that point to make it continuous. This type of function is said to have a removable discontinuity. Let’s look at the function represented by the graph in [link] . The function has a limit. However, there is a hole at . The hole can be filled by extending the domain to include the input and defining the corresponding output of the function at that value as the limit of the function at .
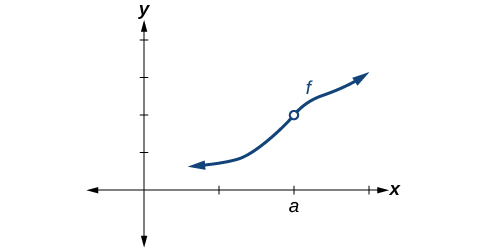
A function has a removable discontinuity at if the limit, exists, but either
Notification Switch
Would you like to follow the 'Precalculus' conversation and receive update notifications?

|
|
|
|
|

|
|

|
|

|
|

|
|

|
|

|
|

|
|
|
|
|

|
|

|