<< Chapter < Page Chapter >> Page >

Writing a cartesian equation in polar form

Write the Cartesian equation x 2 + y 2 = 9 in polar form.

The goal is to eliminate x and y from the equation and introduce r and θ . Ideally, we would write the equation r as a function of θ . To obtain the polar form, we will use the relationships between ( x , y ) and ( r , θ ) . Since x = r cos θ and y = r sin θ , we can substitute and solve for r .

    ( r cos θ ) 2 + ( r sin θ ) 2 = 9     r 2 cos 2 θ + r 2 sin 2 θ = 9      r 2 ( cos 2 θ + sin 2 θ ) = 9                            r 2 ( 1 ) = 9   Substitute cos 2 θ + sin 2 θ = 1.                                   r = ± 3 Use the square root property .

Thus, x 2 + y 2 = 9 , r = 3 , and r = 3 should generate the same graph. See [link] .

Plotting a circle of radius 3 with center at the origin in polar and rectangular coordinates. It is the same in both systems.
(a) Cartesian form x 2 + y 2 = 9 (b) Polar form r = 3

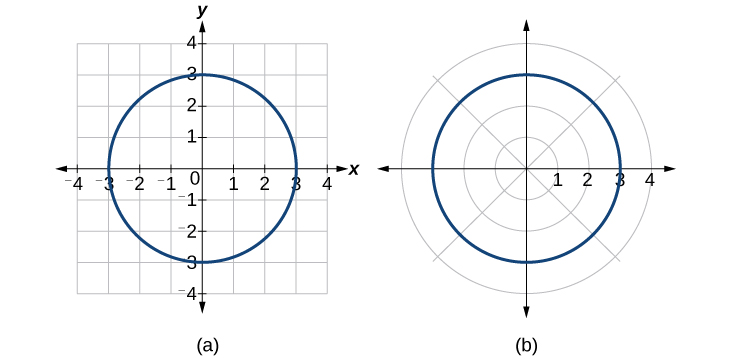
To graph a circle in rectangular form, we must first solve for y .

x 2 + y 2 = 9          y 2 = 9 x 2            y = ± 9 x 2

Note that this is two separate functions, since a circle fails the vertical line test. Therefore, we need to enter the positive and negative square roots into the calculator separately, as two equations in the form Y 1 = 9 x 2 and Y 2 = 9 x 2 . Press GRAPH.

Got questions? Get instant answers now!

Rewriting a cartesian equation as a polar equation

Rewrite the Cartesian equation x 2 + y 2 = 6 y as a polar equation.

This equation appears similar to the previous example, but it requires different steps to convert the equation.

We can still follow the same procedures we have already learned and make the following substitutions:

r 2 = 6 y Use  x 2 + y 2 = r 2 . r 2 = 6 r sin θ Substitute y = r sin θ .         r 2 6 r sin θ = 0 Set equal to 0 .        r ( r 6 sin θ ) = 0 Factor and solve . r = 0 We reject  r = 0 , as it only represents one point,  ( 0 , 0 ) . or r = 6 sin θ

Therefore, the equations x 2 + y 2 = 6 y and r = 6 sin θ should give us the same graph. See [link] .

Plots of the equations stated above - the plots are the same in both rectangular and polar coordinates. They are circles.
(a) Cartesian form x 2 + y 2 = 6 y (b) polar form r = 6 sin θ

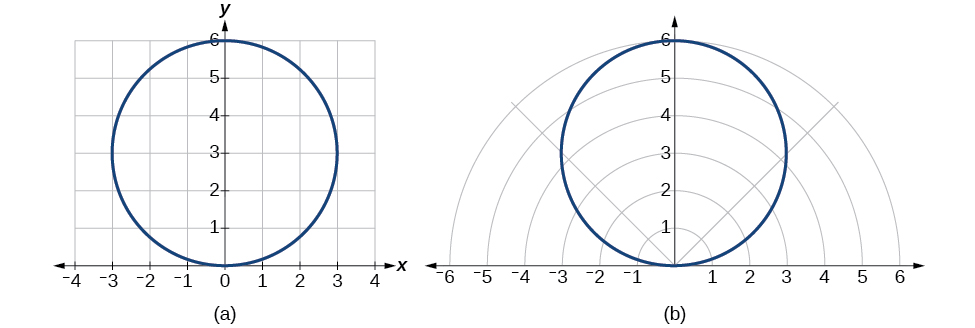
The Cartesian or rectangular equation is plotted on the rectangular grid, and the polar equation is plotted on the polar grid. Clearly, the graphs are identical.

Got questions? Get instant answers now!

Rewriting a cartesian equation in polar form

Rewrite the Cartesian equation y = 3 x + 2 as a polar equation.

We will use the relationships x = r cos θ and y = r sin θ .

                         y = 3 x + 2                   r sin θ = 3 r cos θ + 2 r sin θ 3 r cos θ = 2 r ( sin θ 3 cos θ ) = 2 Isolate  r .                        r = 2 sin θ 3 cos θ Solve for  r .
Got questions? Get instant answers now!

Rewrite the Cartesian equation y 2 = 3 x 2 in polar form.

r = 3

Got questions? Get instant answers now!

Identify and graph polar equations by converting to rectangular equations

We have learned how to convert rectangular coordinates to polar coordinates, and we have seen that the points are indeed the same. We have also transformed polar equations to rectangular equations and vice versa. Now we will demonstrate that their graphs, while drawn on different grids, are identical.

Graphing a polar equation by converting to a rectangular equation

Covert the polar equation r = 2 sec θ to a rectangular equation, and draw its corresponding graph.

The conversion is

            r = 2 sec θ          r = 2 cos θ   r cos θ = 2 x = 2

Notice that the equation r = 2 sec θ drawn on the polar grid is clearly the same as the vertical line x = 2 drawn on the rectangular grid (see [link] ). Just as x = c is the standard form for a vertical line in rectangular form, r = c sec θ is the standard form for a vertical line in polar form.

Plots of the equations stated above - the plots are the same in both rectangular and polar coordinates. They are lines.
(a) Polar grid (b) Rectangular coordinate system

A similar discussion would demonstrate that the graph of the function r = 2 csc θ will be the horizontal line y = 2. In fact, r = c csc θ is the standard form for a horizontal line in polar form, corresponding to the rectangular form y = c .

Got questions? Get instant answers now!

Questions & Answers

differentiate between demand and supply giving examples
Lambiv Reply
differentiated between demand and supply using examples
Lambiv
what is labour ?
Lambiv
how will I do?
Venny Reply
how is the graph works?I don't fully understand
Rezat Reply
information
Eliyee
devaluation
Eliyee
t
WARKISA
hi guys good evening to all
Lambiv
multiple choice question
Aster Reply
appreciation
Eliyee
explain perfect market
Lindiwe Reply
In economics, a perfect market refers to a theoretical construct where all participants have perfect information, goods are homogenous, there are no barriers to entry or exit, and prices are determined solely by supply and demand. It's an idealized model used for analysis,
Ezea
What is ceteris paribus?
Shukri Reply
other things being equal
AI-Robot
When MP₁ becomes negative, TP start to decline. Extuples Suppose that the short-run production function of certain cut-flower firm is given by: Q=4KL-0.6K2 - 0.112 • Where is quantity of cut flower produced, I is labour input and K is fixed capital input (K-5). Determine the average product of lab
Kelo
Extuples Suppose that the short-run production function of certain cut-flower firm is given by: Q=4KL-0.6K2 - 0.112 • Where is quantity of cut flower produced, I is labour input and K is fixed capital input (K-5). Determine the average product of labour (APL) and marginal product of labour (MPL)
Kelo
yes,thank you
Shukri
Can I ask you other question?
Shukri
what is monopoly mean?
Habtamu Reply
What is different between quantity demand and demand?
Shukri Reply
Quantity demanded refers to the specific amount of a good or service that consumers are willing and able to purchase at a give price and within a specific time period. Demand, on the other hand, is a broader concept that encompasses the entire relationship between price and quantity demanded
Ezea
ok
Shukri
how do you save a country economic situation when it's falling apart
Lilia Reply
what is the difference between economic growth and development
Fiker Reply
Economic growth as an increase in the production and consumption of goods and services within an economy.but Economic development as a broader concept that encompasses not only economic growth but also social & human well being.
Shukri
production function means
Jabir
What do you think is more important to focus on when considering inequality ?
Abdisa Reply
any question about economics?
Awais Reply
sir...I just want to ask one question... Define the term contract curve? if you are free please help me to find this answer 🙏
Asui
it is a curve that we get after connecting the pareto optimal combinations of two consumers after their mutually beneficial trade offs
Awais
thank you so much 👍 sir
Asui
In economics, the contract curve refers to the set of points in an Edgeworth box diagram where both parties involved in a trade cannot be made better off without making one of them worse off. It represents the Pareto efficient allocations of goods between two individuals or entities, where neither p
Cornelius
In economics, the contract curve refers to the set of points in an Edgeworth box diagram where both parties involved in a trade cannot be made better off without making one of them worse off. It represents the Pareto efficient allocations of goods between two individuals or entities,
Cornelius
Suppose a consumer consuming two commodities X and Y has The following utility function u=X0.4 Y0.6. If the price of the X and Y are 2 and 3 respectively and income Constraint is birr 50. A,Calculate quantities of x and y which maximize utility. B,Calculate value of Lagrange multiplier. C,Calculate quantities of X and Y consumed with a given price. D,alculate optimum level of output .
Feyisa Reply
Answer
Feyisa
c
Jabir
the market for lemon has 10 potential consumers, each having an individual demand curve p=101-10Qi, where p is price in dollar's per cup and Qi is the number of cups demanded per week by the i th consumer.Find the market demand curve using algebra. Draw an individual demand curve and the market dema
Gsbwnw Reply
suppose the production function is given by ( L, K)=L¼K¾.assuming capital is fixed find APL and MPL. consider the following short run production function:Q=6L²-0.4L³ a) find the value of L that maximizes output b)find the value of L that maximizes marginal product
Abdureman
types of unemployment
Yomi Reply
What is the difference between perfect competition and monopolistic competition?
Mohammed
Got questions? Join the online conversation and get instant answers!
Jobilize.com Reply
Practice Key Terms 3

Get Jobilize Job Search Mobile App in your pocket Now!

Get it on Google Play Download on the App Store Now


Source:  OpenStax, Precalculus. OpenStax CNX. Jan 19, 2016 Download for free at https://legacy.cnx.org/content/col11667/1.6
Google Play and the Google Play logo are trademarks of Google Inc.

Notification Switch

Would you like to follow the 'Precalculus' conversation and receive update notifications?

Ask