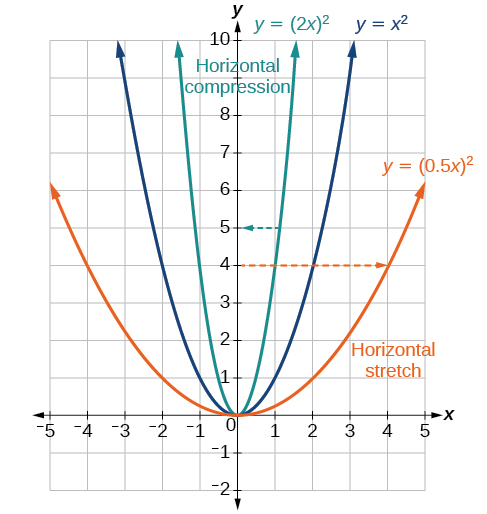
Now we consider changes to the inside of a function. When we multiply a function’s input by a positive constant, we get a function whose graph is stretched or compressed horizontally in relation to the graph of the original function. If the constant is between 0 and 1, we get a
horizontal stretch ; if the constant is greater than 1, we get a
horizontal compression of the function.
Given a function
the form
results in a horizontal stretch or compression. Consider the function
Observe
[link] . The graph of
is a horizontal stretch of the graph of the function
by a factor of 2. The graph of
is a horizontal compression of the graph of the function
by a factor of 2.
Horizontal stretches and compressions
Given a function
a new function
where
is a constant, is a
horizontal stretch or
horizontal compression of the function
If
then the graph will be compressed by
If
then the graph will be stretched by
If
then there will be combination of a horizontal stretch or compression with a horizontal reflection.
Given a description of a function, sketch a horizontal compression or stretch.
Write a formula to represent the function.
Set
where
for a compression or
for a stretch.
Graphing a horizontal compression
Suppose a scientist is comparing a population of fruit flies to a population that progresses through its lifespan twice as fast as the original population. In other words, this new population,
will progress in 1 hour the same amount as the original population does in 2 hours, and in 2 hours, it will progress as much as the original population does in 4 hours. Sketch a graph of this population.
Symbolically, we could write
See
[link] for a graphical comparison of the original population and the compressed population.
(a) Original population graph (b) Compressed population graph
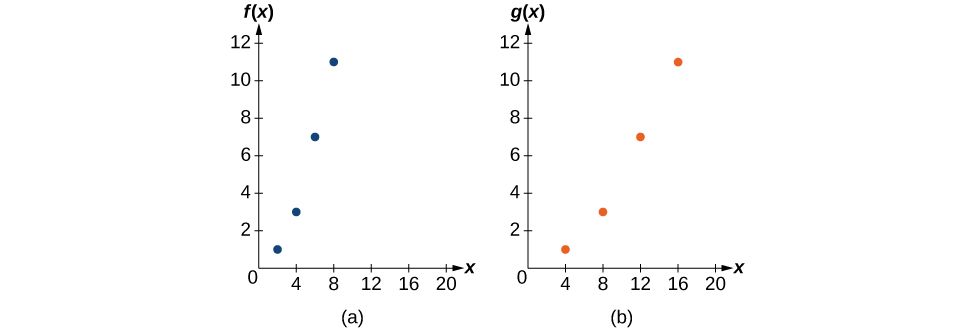
Finding a horizontal stretch for a tabular function
A function
is given as
[link] . Create a table for the function
2
4
6
8
1
3
7
11
The formula
tells us that the output values for
are the same as the output values for the function
at an input half the size. Notice that we do not have enough information to determine
because
and we do not have a value for
in our table. Our input values to
will need to be twice as large to get inputs for
that we can evaluate. For example, we can determine
We do the same for the other values to produce
[link] .
4
8
12
16
1
3
7
11
[link] shows the graphs of both of these sets of points.
The graph of
looks like the graph of
horizontally compressed. Because
ends at
and
ends at
we can see that the
values have been compressed by
because
We might also notice that
and
Either way, we can describe this relationship as
This is a horizontal compression by
is it possible to leave every good at the same level
Joseph
I don't think so. because check it, if the demand for chicken increases, people will no longer consume fish like they used to causing a fall in the demand for fish
Anuolu
is not really possible to let the value of a goods to be same at the same time.....
Salome
Suppose the inflation rate is 6%, does it mean that all the goods you purchase will cost
6% more than previous year? Provide with reasoning.
Not necessarily. To measure the inflation rate economists normally use an averaged price index of a basket of certain goods. So if you purchase goods included in the basket, you will notice that you pay 6% more, otherwise not necessarily.
Good day
How do I calculate this question: C= 100+5yd G= 2000 T= 2000 I(planned)=200.
Suppose the actual output is 3000. What is the level of planned expenditures at this level of output?
I am Camara from Guinea west Africa... happy to meet you guys here
Sekou
ma management ho
Amisha
ahile becheclor ho
Amisha
hjr ktm bta ho
ani k kaam grnu hunxa tw
Amisha
belatari
Amisha
1st year ho
Amisha
nd u
Amisha
ahh
Amisha
kaha biratnagar
Amisha
ys
Amisha
kina k vo
Amisha
money as unit of account means what?
Kalombe
A unit of account is something that can be used to value goods and services and make calculations
Jim
all of you please speak in English I can't understand you're language
Muhammad
I want to know how can we define macroeconomics in one line
Muhammad
it must be .9 or 0.9
no Mpc is greater than 1
Y=100+.9Y+50
Y-.9Y=150
0.1Y/0.1=150/0.1
Y=1500
Kalombe
Mercy is it clear?😋
Kalombe
hi can someone help me on this question
If a negative shocks shifts the IS curve to the left, what type of policy do you suggest so as to stabilize the level of output?
discuss your answer using appropriate graph.


![Two side-by-side graphs. The first graph has function for original population whose domain is [0,7] and range is [0,3]. The maximum value occurs at (3,3). The second graph has the same shape as the first except it is half as wide. It is a graph of transformed population, with a domain of [0, 3.5] and a range of [0,3]. The maximum occurs at (1.5, 3).](/ocw/mirror/col11667/m49312/CNX_Precalc_Figure_01_05_029ab.jpg)