<< Chapter < Page Chapter >> Page >

Determine whether the function is increasing or decreasing.

g ( x ) = x + 2

Got questions? Get instant answers now!

Given each set of information, find a linear equation that satisfies the given conditions, if possible.

Passes through ( 7 , 5 ) and ( 3 , 17 )

y = 3 x + 26

Got questions? Get instant answers now!

Given each set of information, find a linear equation that satisfies the given conditions, if possible.

x -intercept at ( 6 , 0 ) and y -intercept at ( 0 , 1 0 )

Got questions? Get instant answers now!

Find the slope of the line shown in the line graph.

3

Got questions? Get instant answers now!

Find the slope of the line graphed.

Got questions? Get instant answers now!

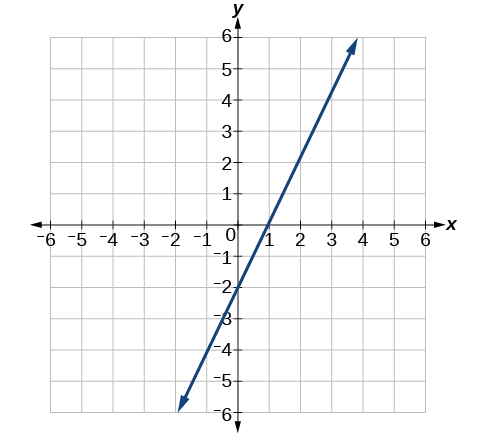
Write an equation in slope-intercept form for the line shown.

y = 2 x 2

Got questions? Get instant answers now!

Does the following table represent a linear function? If so, find the linear equation that models the data.

x –4 0 2 10
g ( x ) 18 –2 –12 –52
Got questions? Get instant answers now!

Does the following table represent a linear function? If so, find the linear equation that models the data.

x 6 8 12 26
g ( x ) –8 –12 –18 –46

Not linear.

Got questions? Get instant answers now!

On June 1 st , a company has $4,000,000 profit. If the company then loses 150,000 dollars per day thereafter in the month of June, what is the company’s profit n th day after June 1 st ?

Got questions? Get instant answers now!

Graphs of Linear Functions

For the following exercises, determine whether the lines given by the equations below are parallel, perpendicular, or neither parallel nor perpendicular:

2 x 6 y = 12 x + 3 y = 1

parallel

Got questions? Get instant answers now!

y = 1 3 x 2 3 x + y = 9

Got questions? Get instant answers now!

For the following exercises, find the x - and y - intercepts of the given equation

7 x + 9 y = −63

( –9 , 0 ) ; ( 0 , –7 )

Got questions? Get instant answers now!

For the following exercises, use the descriptions of the pairs of lines to find the slopes of Line 1 and Line 2. Is each pair of lines parallel, perpendicular, or neither?

  • Line 1: Passes through ( 5 , 11 ) and ( 10 , 1 )
  • Line 2: Passes through ( −1 , 3 ) and ( −5 , 11 )

Line 1: m = 2 ; Line 2: m = 2 ; Parallel

Got questions? Get instant answers now!
  • Line 1: Passes through ( 8 , −10 ) and ( 0 , −26 )
  • Line 2: Passes through ( 2 , 5 ) and ( 4 , 4 )
Got questions? Get instant answers now!

Write an equation for a line perpendicular to f ( x ) = 5 x 1 and passing through the point (5, 20).

y = 0.2 x + 21

Got questions? Get instant answers now!

Find the equation of a line with a y - intercept of ( 0 ,   2 ) and slope 1 2 .

Got questions? Get instant answers now!

Sketch a graph of the linear function f ( t ) = 2 t 5 .

Got questions? Get instant answers now!

Find the point of intersection for the 2 linear functions: x = y + 6 2 x y = 13

Got questions? Get instant answers now!

A car rental company offers two plans for renting a car.

  • Plan A: 25 dollars per day and 10 cents per mile
  • Plan B: 50 dollars per day with free unlimited mileage

How many miles would you need to drive for plan B to save you money?

250.

Got questions? Get instant answers now!

Modeling with Linear Functions

Find the area of a triangle bounded by the y axis, the line f ( x ) = 10 2 x , and the line perpendicular to f that passes through the origin.

Got questions? Get instant answers now!

A town’s population increases at a constant rate. In 2010 the population was 55,000. By 2012 the population had increased to 76,000. If this trend continues, predict the population in 2016.

118,000.

Got questions? Get instant answers now!

The number of people afflicted with the common cold in the winter months dropped steadily by 50 each year since 2004 until 2010. In 2004, 875 people were inflicted.

Find the linear function that models the number of people afflicted with the common cold C as a function of the year, t . When will no one be afflicted?

Got questions? Get instant answers now!

For the following exercises, use the graph in [link] showing the profit, y , in thousands of dollars, of a company in a given year, x , where x represents years since 1980.

Find the linear function y , where y depends on x , the number of years since 1980.

y = 3 00 x + 11 , 5 00

Got questions? Get instant answers now!

Questions & Answers

Ayele, K., 2003. Introductory Economics, 3rd ed., Addis Ababa.
Widad Reply
can you send the book attached ?
Ariel
?
Ariel
What is economics
Widad Reply
the study of how humans make choices under conditions of scarcity
AI-Robot
U(x,y) = (x×y)1/2 find mu of x for y
Desalegn Reply
U(x,y) = (x×y)1/2 find mu of x for y
Desalegn
what is ecnomics
Jan Reply
this is the study of how the society manages it's scarce resources
Belonwu
what is macroeconomic
John Reply
macroeconomic is the branch of economics which studies actions, scale, activities and behaviour of the aggregate economy as a whole.
husaini
etc
husaini
difference between firm and industry
husaini Reply
what's the difference between a firm and an industry
Abdul
firm is the unit which transform inputs to output where as industry contain combination of firms with similar production 😅😅
Abdulraufu
Suppose the demand function that a firm faces shifted from Qd  120 3P to Qd  90  3P and the supply function has shifted from QS  20  2P to QS 10  2P . a) Find the effect of this change on price and quantity. b) Which of the changes in demand and supply is higher?
Toofiq Reply
explain standard reason why economic is a science
innocent Reply
factors influencing supply
Petrus Reply
what is economic.
Milan Reply
scares means__________________ends resources. unlimited
Jan
economics is a science that studies human behaviour as a relationship b/w ends and scares means which have alternative uses
Jan
calculate the profit maximizing for demand and supply
Zarshad Reply
Why qualify 28 supplies
Milan
what are explicit costs
Nomsa Reply
out-of-pocket costs for a firm, for example, payments for wages and salaries, rent, or materials
AI-Robot
concepts of supply in microeconomics
David Reply
economic overview notes
Amahle Reply
identify a demand and a supply curve
Salome Reply
i don't know
Parul
there's a difference
Aryan
Demand curve shows that how supply and others conditions affect on demand of a particular thing and what percent demand increase whith increase of supply of goods
Israr
Hi Sir please how do u calculate Cross elastic demand and income elastic demand?
Abari
Got questions? Join the online conversation and get instant answers!
Jobilize.com Reply
Practice Key Terms 5

Get Jobilize Job Search Mobile App in your pocket Now!

Get it on Google Play Download on the App Store Now


Source:  OpenStax, Precalculus. OpenStax CNX. Jan 19, 2016 Download for free at https://legacy.cnx.org/content/col11667/1.6
Google Play and the Google Play logo are trademarks of Google Inc.

Notification Switch

Would you like to follow the 'Precalculus' conversation and receive update notifications?

Ask