<< Chapter < Page Chapter >> Page >

Given a logarithmic function, identify the domain.

  1. Set up an inequality showing the argument greater than zero.
  2. Solve for x .
  3. Write the domain in interval notation.

Identifying the domain of a logarithmic shift

What is the domain of f ( x ) = log 2 ( x + 3 ) ?

The logarithmic function is defined only when the input is positive, so this function is defined when x + 3 > 0. Solving this inequality,

x + 3 > 0 The input must be positive . x > 3 Subtract 3 .

The domain of f ( x ) = log 2 ( x + 3 ) is ( 3 , ) .

Got questions? Get instant answers now!

What is the domain of f ( x ) = log 5 ( x 2 ) + 1 ?

( 2 , )

Got questions? Get instant answers now!

Identifying the domain of a logarithmic shift and reflection

What is the domain of f ( x ) = log ( 5 2 x ) ?

The logarithmic function is defined only when the input is positive, so this function is defined when 5 2 x > 0 . Solving this inequality,

5 2 x > 0 The input must be positive . 2 x > 5 Subtract  5. x < 5 2 Divide by  2  and switch the inequality .

The domain of f ( x ) = log ( 5 2 x ) is ( , 5 2 ) .

Got questions? Get instant answers now!

What is the domain of f ( x ) = log ( x 5 ) + 2 ?

( 5 , )

Got questions? Get instant answers now!

Graphing logarithmic functions

Now that we have a feel for the set of values for which a logarithmic function is defined, we move on to graphing logarithmic functions. The family of logarithmic functions includes the parent function y = log b ( x ) along with all its transformations: shifts, stretches, compressions, and reflections.

We begin with the parent function y = log b ( x ) . Because every logarithmic function of this form is the inverse of an exponential function with the form y = b x , their graphs will be reflections of each other across the line y = x . To illustrate this, we can observe the relationship between the input and output values of y = 2 x and its equivalent x = log 2 ( y ) in [link] .

x 3 2 1 0 1 2 3
2 x = y 1 8 1 4 1 2 1 2 4 8
log 2 ( y ) = x 3 2 1 0 1 2 3

Using the inputs and outputs from [link] , we can build another table to observe the relationship between points on the graphs of the inverse functions f ( x ) = 2 x and g ( x ) = log 2 ( x ) . See [link] .

f ( x ) = 2 x ( 3 , 1 8 ) ( 2 , 1 4 ) ( 1 , 1 2 ) ( 0 , 1 ) ( 1 , 2 ) ( 2 , 4 ) ( 3 , 8 )
g ( x ) = log 2 ( x ) ( 1 8 , 3 ) ( 1 4 , 2 ) ( 1 2 , 1 ) ( 1 , 0 ) ( 2 , 1 ) ( 4 , 2 ) ( 8 , 3 )

As we’d expect, the x - and y -coordinates are reversed for the inverse functions. 
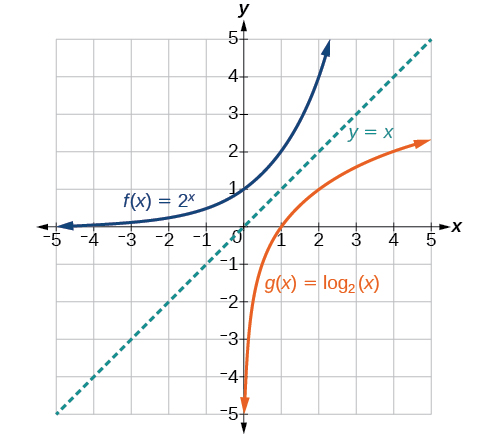
[link] shows the graph of f and g .

Graph of two functions, f(x)=2^x and g(x)=log_2(x), with the line y=x denoting the axis of symmetry.
Notice that the graphs of f ( x ) = 2 x and g ( x ) = log 2 ( x ) are reflections about the line y = x .

Observe the following from the graph:

  • f ( x ) = 2 x has a y -intercept at ( 0 , 1 ) and g ( x ) = log 2 ( x ) has an x - intercept at ( 1 , 0 ) .
  • The domain of f ( x ) = 2 x , ( , ) , is the same as the range of g ( x ) = log 2 ( x ) .
  • The range of f ( x ) = 2 x , ( 0 , ) , is the same as the domain of g ( x ) = log 2 ( x ) .

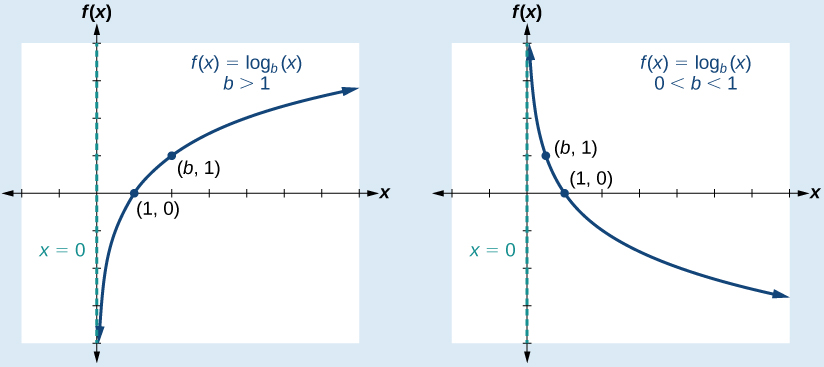
Characteristics of the graph of the parent function, f ( x ) = log b ( x )

For any real number x and constant b > 0 , b 1 , we can see the following characteristics in the graph of f ( x ) = log b ( x ) :

  • one-to-one function
  • vertical asymptote: x = 0
  • domain: ( 0 , )
  • range: ( , )
  • x- intercept: ( 1 , 0 ) and key point ( b , 1 )
  • y -intercept: none
  • increasing if b > 1
  • decreasing if 0 < b < 1

See [link] .

Two graphs of the function f(x)=log_b(x) with points (1,0) and (b, 1). The first graph shows the line when b>1, and the second graph shows the line when 0<b<1.

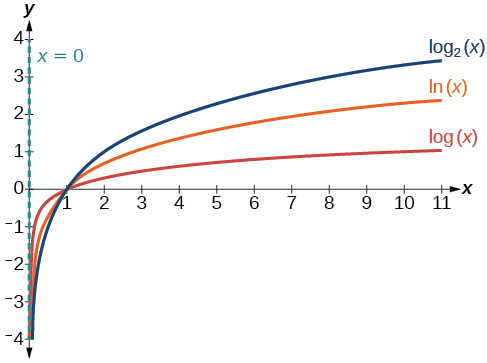
[link] shows how changing the base b in f ( x ) = log b ( x ) can affect the graphs. Observe that the graphs compress vertically as the value of the base increases. ( Note: recall that the function ln ( x ) has base e 2 . 718.)

Graph of three equations: y=log_2(x) in blue, y=ln(x) in orange, and y=log(x) in red. The y-axis is the asymptote.
The graphs of three logarithmic functions with different bases, all greater than 1.

Questions & Answers

Ayele, K., 2003. Introductory Economics, 3rd ed., Addis Ababa.
Widad Reply
can you send the book attached ?
Ariel
?
Ariel
What is economics
Widad Reply
the study of how humans make choices under conditions of scarcity
AI-Robot
U(x,y) = (x×y)1/2 find mu of x for y
Desalegn Reply
U(x,y) = (x×y)1/2 find mu of x for y
Desalegn
what is ecnomics
Jan Reply
this is the study of how the society manages it's scarce resources
Belonwu
what is macroeconomic
John Reply
macroeconomic is the branch of economics which studies actions, scale, activities and behaviour of the aggregate economy as a whole.
husaini
etc
husaini
difference between firm and industry
husaini Reply
what's the difference between a firm and an industry
Abdul
firm is the unit which transform inputs to output where as industry contain combination of firms with similar production 😅😅
Abdulraufu
Suppose the demand function that a firm faces shifted from Qd  120 3P to Qd  90  3P and the supply function has shifted from QS  20  2P to QS 10  2P . a) Find the effect of this change on price and quantity. b) Which of the changes in demand and supply is higher?
Toofiq Reply
explain standard reason why economic is a science
innocent Reply
factors influencing supply
Petrus Reply
what is economic.
Milan Reply
scares means__________________ends resources. unlimited
Jan
economics is a science that studies human behaviour as a relationship b/w ends and scares means which have alternative uses
Jan
calculate the profit maximizing for demand and supply
Zarshad Reply
Why qualify 28 supplies
Milan
what are explicit costs
Nomsa Reply
out-of-pocket costs for a firm, for example, payments for wages and salaries, rent, or materials
AI-Robot
concepts of supply in microeconomics
David Reply
economic overview notes
Amahle Reply
identify a demand and a supply curve
Salome Reply
i don't know
Parul
there's a difference
Aryan
Demand curve shows that how supply and others conditions affect on demand of a particular thing and what percent demand increase whith increase of supply of goods
Israr
Hi Sir please how do u calculate Cross elastic demand and income elastic demand?
Abari
Got questions? Join the online conversation and get instant answers!
Jobilize.com Reply

Get Jobilize Job Search Mobile App in your pocket Now!

Get it on Google Play Download on the App Store Now


Source:  OpenStax, Precalculus. OpenStax CNX. Jan 19, 2016 Download for free at https://legacy.cnx.org/content/col11667/1.6
Google Play and the Google Play logo are trademarks of Google Inc.

Notification Switch

Would you like to follow the 'Precalculus' conversation and receive update notifications?

Ask