<< Chapter < Page Chapter >> Page >

Graph f ( x ) = 3 4 x + 6 by plotting points.

Got questions? Get instant answers now!

Graphing a function using y- Intercept and slope

Another way to graph linear functions is by using specific characteristics of the function rather than plotting points. The first characteristic is its y- intercept, which is the point at which the input value is zero. To find the y- intercept , we can set x = 0 in the equation.

The other characteristic of the linear function is its slope m , which is a measure of its steepness. Recall that the slope is the rate of change of the function. The slope of a function is equal to the ratio of the change in outputs to the change in inputs. Another way to think about the slope is by dividing the vertical difference, or rise, by the horizontal difference, or run. We encountered both the y- intercept and the slope in Linear Functions .

Let’s consider the following function.

f ( x ) = 1 2 x + 1

The slope is 1 2 . Because the slope is positive, we know the graph will slant upward from left to right. The y- intercept is the point on the graph when x = 0. The graph crosses the y -axis at ( 0 , 1 ) . Now we know the slope and the y -intercept. We can begin graphing by plotting the point ( 0 , 1 ) We know that the slope is rise over run, m = rise run . From our example, we have m = 1 2 , which means that the rise is 1 and the run is 2. So starting from our y -intercept ( 0 , 1 ) , we can rise 1 and then run 2, or run 2 and then rise 1. We repeat until we have a few points, and then we draw a line through the points as shown in [link] .

Graphical interpretation of a linear function

In the equation f ( x ) = m x + b

  • b is the y -intercept of the graph and indicates the point ( 0 , b ) at which the graph crosses the y -axis.
  • m is the slope of the line and indicates the vertical displacement (rise) and horizontal displacement (run) between each successive pair of points. Recall the formula for the slope:
m = change in output (rise) change in input (run) = Δ y Δ x = y 2 y 1 x 2 x 1

Do all linear functions have y -intercepts?

Yes. All linear functions cross the y-axis and therefore have y-intercepts. (Note: A vertical line parallel to the y-axis does not have a y-intercept, but it is not a function. )

Given the equation for a linear function, graph the function using the y -intercept and slope.
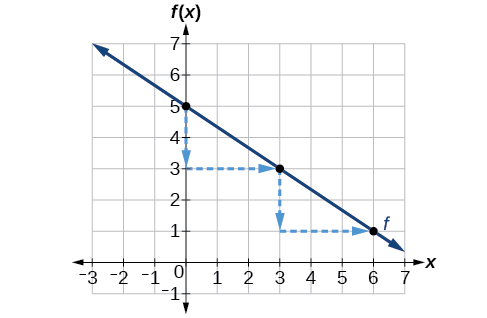
  1. Evaluate the function at an input value of zero to find the y- intercept.
  2. Identify the slope as the rate of change of the input value.
  3. Plot the point represented by the y- intercept.
  4. Use rise run to determine at least two more points on the line.
  5. Sketch the line that passes through the points.

Graphing by using the y- Intercept and slope

Graph f ( x ) = 2 3 x + 5 using the y- intercept and slope.

Evaluate the function at x = 0 to find the y- intercept. The output value when x = 0 is 5, so the graph will cross the y -axis at ( 0 , 5 ) .

According to the equation for the function, the slope of the line is 2 3 . This tells us that for each vertical decrease in the “rise” of 2 units, the “run” increases by 3 units in the horizontal direction. We can now graph the function by first plotting the y -intercept on the graph in [link] . From the initial value ( 0 , 5 ) we move down 2 units and to the right 3 units. We can extend the line to the left and right by repeating, and then draw a line through the points.

Got questions? Get instant answers now!

Questions & Answers

how do you get the 2/50
Abba Reply
number of sport play by 50 student construct discrete data
Aminu Reply
width of the frangebany leaves on how to write a introduction
Theresa Reply
Solve the mean of variance
Veronica Reply
Step 1: Find the mean. To find the mean, add up all the scores, then divide them by the number of scores. ... Step 2: Find each score's deviation from the mean. ... Step 3: Square each deviation from the mean. ... Step 4: Find the sum of squares. ... Step 5: Divide the sum of squares by n – 1 or N.
kenneth
what is error
Yakuba Reply
Is mistake done to something
Vutshila
Hy
anas
hy
What is the life teble
anas
hy
Jibrin
statistics is the analyzing of data
Tajudeen Reply
what is statics?
Zelalem Reply
how do you calculate mean
Gloria Reply
diveving the sum if all values
Shaynaynay
let A1,A2 and A3 events be independent,show that (A1)^c, (A2)^c and (A3)^c are independent?
Fisaye Reply
what is statistics
Akhisani Reply
data collected all over the world
Shaynaynay
construct a less than and more than table
Imad Reply
The sample of 16 students is taken. The average age in the sample was 22 years with astandard deviation of 6 years. Construct a 95% confidence interval for the age of the population.
Aschalew Reply
Bhartdarshan' is an internet-based travel agency wherein customer can see videos of the cities they plant to visit. The number of hits daily is a normally distributed random variable with a mean of 10,000 and a standard deviation of 2,400 a. what is the probability of getting more than 12,000 hits? b. what is the probability of getting fewer than 9,000 hits?
Akshay Reply
Bhartdarshan'is an internet-based travel agency wherein customer can see videos of the cities they plan to visit. The number of hits daily is a normally distributed random variable with a mean of 10,000 and a standard deviation of 2,400. a. What is the probability of getting more than 12,000 hits
Akshay
1
Bright
Sorry i want to learn more about this question
Bright
Someone help
Bright
a= 0.20233 b=0.3384
Sufiyan
a
Shaynaynay
How do I interpret level of significance?
Mohd Reply
It depends on your business problem or in Machine Learning you could use ROC- AUC cruve to decide the threshold value
Shivam
how skewness and kurtosis are used in statistics
Owen Reply
yes what is it
Taneeya
Got questions? Join the online conversation and get instant answers!
Jobilize.com Reply
Practice Key Terms 5

Get Jobilize Job Search Mobile App in your pocket Now!

Get it on Google Play Download on the App Store Now


Source:  OpenStax, Precalculus. OpenStax CNX. Jan 19, 2016 Download for free at https://legacy.cnx.org/content/col11667/1.6
Google Play and the Google Play logo are trademarks of Google Inc.

Notification Switch

Would you like to follow the 'Precalculus' conversation and receive update notifications?

Ask