

| << Chapter < Page | Chapter >> Page > |
If the function is graphed, find and interpret the slope of the function.
When will the output reached 100,000?
Ten years after the model began.
What is the output in the year 12 years from the onset of the model?
For the following exercises, consider this scenario: The weight of a newborn is 7.5 pounds. The baby gained one-half pound a month for its first year.
Find the linear function that models the baby’s weight as a function of the age of the baby, in months,
Find a reasonable domain and range for the function .
If the function is graphed, find and interpret the x - and y -intercepts.
: The x -intercept is not a plausible set of data for this model because it means the baby weighed 0 pounds 15 months prior to birth. : The baby weighed 7.5 pounds at birth.
If the function W is graphed, find and interpret the slope of the function.
What is the output when the input is 6.2? Interpret your answer.
For the following exercises, consider this scenario: The number of people afflicted with the common cold in the winter months steadily decreased by 205 each year from 2005 until 2010. In 2005, 12,025 people were afflicted.
Find the linear function that models the number of people inflicted with the common cold as a function of the year,
Find a reasonable domain and range for the function
If the function is graphed, find and interpret the x - and y -intercepts.
: In roughly 59 years, the number of people inflicted with the common cold would be 0. : Initially there were 12,025 people afflicted by the common cold.
If the function is graphed, find and interpret the slope of the function.
In what year will the number of people be 9,700?
For the following exercises, use the graph in [link] , which shows the profit, in thousands of dollars, of a company in a given year, where represents the number of years since 1980.
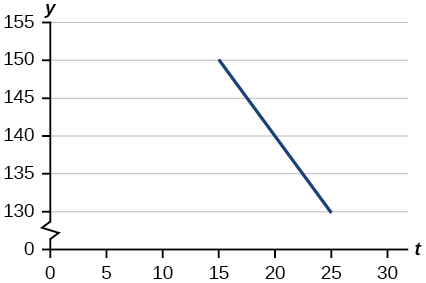
Find the linear function where depends on the number of years since 1980.
Find and interpret the y -intercept.
Find and interpret the x -intercept.
In 2070, the company’s profit will be zero.
Find and interpret the slope.
For the following exercises, use the graph in [link] , which shows the profit, in thousands of dollars, of a company in a given year, where represents the number of years since 1980.
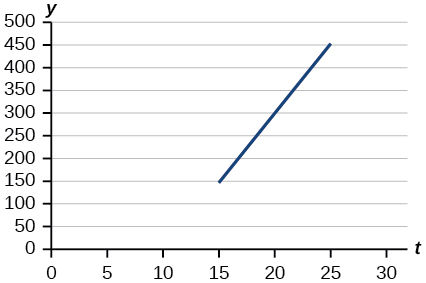
Find the linear function where depends on the number of years since 1980.
Find and interpret the y -intercept.
Find and interpret the x -intercept.
(10, 0) In 1990, the profit earned zero profit.
Find and interpret the slope.
For the following exercises, use the median home values in Mississippi and Hawaii (adjusted for inflation) shown in [link] . Assume that the house values are changing linearly.
| Year | Mississippi | Hawaii |
|---|---|---|
| 1950 | $25,200 | $74,400 |
| 2000 | $71,400 | $272,700 |
In which state have home values increased at a higher rate?
Hawaii
If these trends were to continue, what would be the median home value in Mississippi in 2010?
Notification Switch
Would you like to follow the 'Precalculus' conversation and receive update notifications?

|
|
|
|
|

|
|

|
|

|
|

|
|

|
|

|
|

|
|

|
|

|
|

|