<< Chapter < Page Chapter >> Page >

Using the graph of the function y = f ( x ) shown in [link] , estimate the following limits.
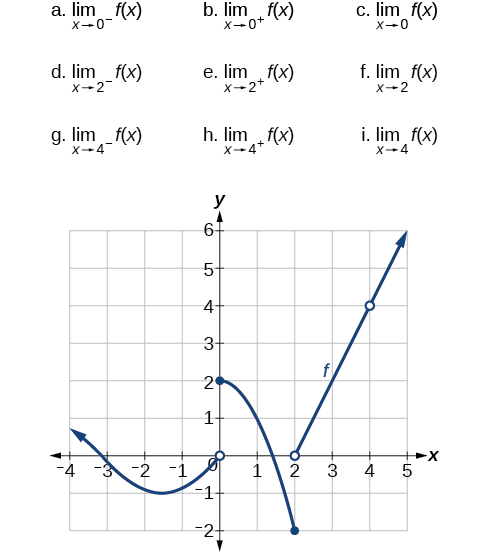
Graph of a piecewise function that has three segments: 1) negative infinity to 0, 2) 0 to 2, and 3) 2 to positive inifnity, which has a discontinuity at (4, 4)

a. 0; b. 2; c. does not exist; d. 2 ; e. 0; f. does not exist; g. 4; h. 4; i. 4

Got questions? Get instant answers now!

Finding a limit using a table

Creating a table is a way to determine limits using numeric information. We create a table of values in which the input values of x approach a from both sides. Then we determine if the output values get closer and closer to some real value, the limit     L .

Let’s consider an example using the following function:

lim x 5 ( x 3 125 x 5 )

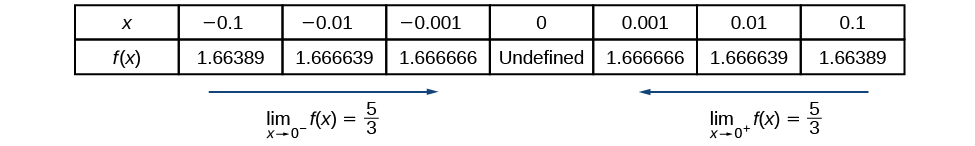
To create the table, we evaluate the function at values close to x = 5. We use some input values less than 5 and some values greater than 5 as in [link] . The table values show that when x > 5 but nearing 5, the corresponding output gets close to 75. When x > 5 but nearing 5, the corresponding output also gets close to 75.

Table shows that as x values approach 5 from the positive or negative direction, f(x) gets very close to 75. But when x is equal to 5, y is undefined.

Because

lim x 5 f ( x ) = 75 = lim x 5 + f ( x ) ,

then

lim x 5 f ( x ) = 75.

Remember that f ( 5 ) does not exist.

Given a function f , use a table to find the limit as x approaches a and the value of f ( a ) , if it exists.

  1. Choose several input values that approach a from both the left and right. Record them in a table.
  2. Evaluate the function at each input value. Record them in the table.
  3. Determine if the table values indicate a left-hand limit and a right-hand limit.
  4. If the left-hand and right-hand limits exist and are equal, there is a two-sided limit.
  5. Replace x with a to find the value of f ( a ) .

Finding a limit using a table

Numerically estimate the limit of the following expression by setting up a table of values on both sides of the limit.

lim x 0 ( 5 sin ( x ) 3 x )

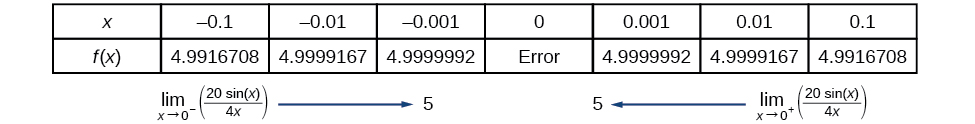
We can estimate the value of a limit, if it exists, by evaluating the function at values near x = 0. We cannot find a function value for x = 0 directly because the result would have a denominator equal to 0, and thus would be undefined.

f ( x ) = 5 sin ( x ) 3 x

We create [link] by choosing several input values close to x = 0 , with half of them less than x = 0 and half of them greater than x = 0. Note that we need to be sure we are using radian mode. We evaluate the function at each input value to complete the table.

The table values indicate that when x < 0 but approaching 0, the corresponding output nears 5 3 .

When x > 0 but approaching 0, the corresponding output also nears 5 3 .

Table shows that as x values approach 0 from the positive or negative direction, f(x) gets very close to 5 over 3. But when x is equal to 0, y is undefined.

Because

lim x 0 f ( x ) = 5 3 = lim x 0 + f ( x ) ,

then

lim x 0 f ( x ) = 5 3 .
Got questions? Get instant answers now!

Is it possible to check our answer using a graphing utility?

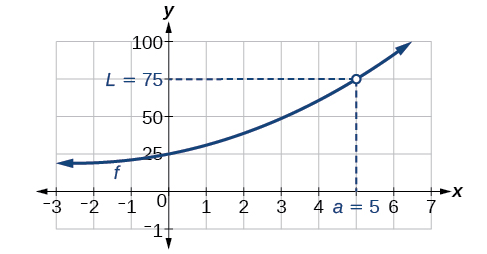
Yes. We previously used a table to find a limit of 75 for the function f ( x ) = x 3 125 x 5 as x approaches 5. To check, we graph the function on a viewing window as shown in [link] . A graphical check shows both branches of the graph of the function get close to the output 75 as x nears 5. Furthermore, we can use the ‘trace’ feature of a graphing calculator. By appraoching x = 5 we may numerically observe the corresponding outputs getting close to 75.

Graph of an increasing function with a discontinuity at (5, 75)

Numerically estimate the limit of the following function by making a table:

lim x 0 ( 20 sin ( x ) 4 x )

lim x 0 ( 20 sin ( x ) 4 x ) = 5

Table showing that f(x) approaches 5 from either side as x approaches 0 from either side.
Got questions? Get instant answers now!

Is one method for determining a limit better than the other?

No. Both methods have advantages. Graphing allows for quick inspection. Tables can be used when graphical utilities aren’t available, and they can be calculated to a higher precision than could be seen with an unaided eye inspecting a graph.

Questions & Answers

A golfer on a fairway is 70 m away from the green, which sits below the level of the fairway by 20 m. If the golfer hits the ball at an angle of 40° with an initial speed of 20 m/s, how close to the green does she come?
Aislinn Reply
cm
tijani
what is titration
John Reply
what is physics
Siyaka Reply
A mouse of mass 200 g falls 100 m down a vertical mine shaft and lands at the bottom with a speed of 8.0 m/s. During its fall, how much work is done on the mouse by air resistance
Jude Reply
Can you compute that for me. Ty
Jude
what is the dimension formula of energy?
David Reply
what is viscosity?
David
what is inorganic
emma Reply
what is chemistry
Youesf Reply
what is inorganic
emma
Chemistry is a branch of science that deals with the study of matter,it composition,it structure and the changes it undergoes
Adjei
please, I'm a physics student and I need help in physics
Adjanou
chemistry could also be understood like the sexual attraction/repulsion of the male and female elements. the reaction varies depending on the energy differences of each given gender. + masculine -female.
Pedro
A ball is thrown straight up.it passes a 2.0m high window 7.50 m off the ground on it path up and takes 1.30 s to go past the window.what was the ball initial velocity
Krampah Reply
2. A sled plus passenger with total mass 50 kg is pulled 20 m across the snow (0.20) at constant velocity by a force directed 25° above the horizontal. Calculate (a) the work of the applied force, (b) the work of friction, and (c) the total work.
Sahid Reply
you have been hired as an espert witness in a court case involving an automobile accident. the accident involved car A of mass 1500kg which crashed into stationary car B of mass 1100kg. the driver of car A applied his brakes 15 m before he skidded and crashed into car B. after the collision, car A s
Samuel Reply
can someone explain to me, an ignorant high school student, why the trend of the graph doesn't follow the fact that the higher frequency a sound wave is, the more power it is, hence, making me think the phons output would follow this general trend?
Joseph Reply
Nevermind i just realied that the graph is the phons output for a person with normal hearing and not just the phons output of the sound waves power, I should read the entire thing next time
Joseph
Follow up question, does anyone know where I can find a graph that accuretly depicts the actual relative "power" output of sound over its frequency instead of just humans hearing
Joseph
"Generation of electrical energy from sound energy | IEEE Conference Publication | IEEE Xplore" ***ieeexplore.ieee.org/document/7150687?reload=true
Ryan
what's motion
Maurice Reply
what are the types of wave
Maurice
answer
Magreth
progressive wave
Magreth
hello friend how are you
Muhammad Reply
fine, how about you?
Mohammed
hi
Mujahid
A string is 3.00 m long with a mass of 5.00 g. The string is held taut with a tension of 500.00 N applied to the string. A pulse is sent down the string. How long does it take the pulse to travel the 3.00 m of the string?
yasuo Reply
Who can show me the full solution in this problem?
Reofrir Reply
Got questions? Join the online conversation and get instant answers!
Jobilize.com Reply
Practice Key Terms 4

Get Jobilize Job Search Mobile App in your pocket Now!

Get it on Google Play Download on the App Store Now


Source:  OpenStax, Precalculus. OpenStax CNX. Jan 19, 2016 Download for free at https://legacy.cnx.org/content/col11667/1.6
Google Play and the Google Play logo are trademarks of Google Inc.

Notification Switch

Would you like to follow the 'Precalculus' conversation and receive update notifications?

Ask