The degree of a polynomial function helps us to determine the number of
intercepts and the number of turning points. A polynomial function of
degree is the product of
factors, so it will have at most
roots or zeros, or
intercepts. The graph of the polynomial function of degree
must have at most
turning points. This means the graph has at most one fewer turning point than the degree of the polynomial or one fewer than the number of factors.
A
continuous function has no breaks in its graph: the graph can be drawn without lifting the pen from the paper. A
smooth curve is a graph that has no sharp corners. The turning points of a smooth graph must always occur at rounded curves. The graphs of polynomial functions are both continuous and smooth.
Intercepts and turning points of polynomials
A polynomial of degree
will have, at most,
x -intercepts and
turning points.
Determining the number of intercepts and turning points of a polynomial
Without graphing the function, determine the local behavior of the function by finding the maximum number of
intercepts and turning points for
The polynomial has a degree of
so there are at most
x -intercepts and at most
turning points.
Drawing conclusions about a polynomial function from the graph
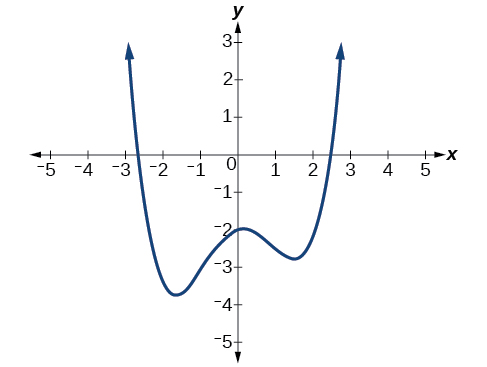
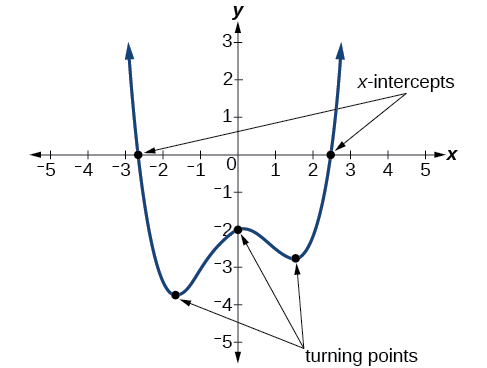
What can we conclude about the polynomial represented by the graph shown in
[link] based on its intercepts and turning points?
The end behavior of the graph tells us this is the graph of an even-degree polynomial. See
[link] .
The graph has 2
intercepts, suggesting a degree of 2 or greater, and 3 turning points, suggesting a degree of 4 or greater. Based on this, it would be reasonable to conclude that the degree is even and at least 4.
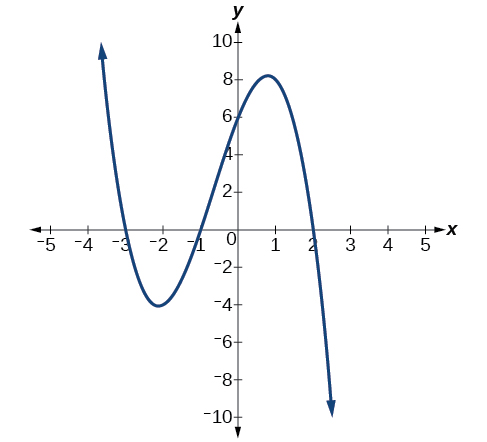
What can we conclude about the polynomial represented by the graph shown in
[link] based on its intercepts and turning points?
The end behavior indicates an odd-degree polynomial function; there are 3
intercepts and 2 turning points, so the degree is odd and at least 3. Because of the end behavior, we know that the lead coefficient must be negative.
Step 1: Find the mean. To find the mean, add up all the scores, then divide them by the number of scores. ...
Step 2: Find each score's deviation from the mean. ...
Step 3: Square each deviation from the mean. ...
Step 4: Find the sum of squares. ...
Step 5: Divide the sum of squares by n – 1 or N.
The sample of 16 students is taken. The average age in the sample was 22 years with astandard deviation of 6 years. Construct a 95% confidence interval for the age of the population.
Bhartdarshan' is an internet-based travel agency wherein customer can see videos of the cities they plant to visit. The number of hits daily is a normally distributed random variable with a mean of 10,000 and a standard deviation of 2,400
a. what is the probability of getting more than 12,000 hits?
b. what is the probability of getting fewer than 9,000 hits?
Bhartdarshan'is an internet-based travel agency wherein customer can see videos of the cities they plan to visit. The number of hits daily is a normally distributed random variable with a mean of 10,000 and a standard deviation of 2,400.
a. What is the probability of getting more than 12,000 hits