The domain of
was given to be all
such that
for any integer
Would the domain of
Yes. The excluded points of the domain follow the vertical asymptotes. Their locations show the horizontal shift and compression or expansion implied by the transformation to the original function’s input.
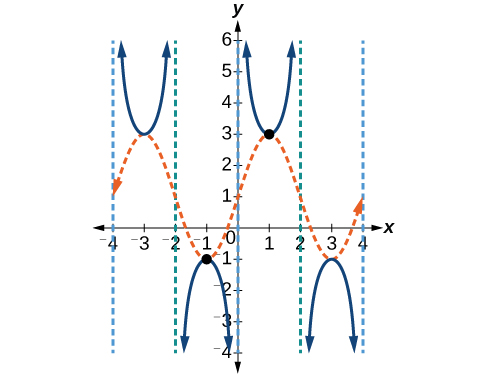
Given a function of the form
graph one period.
Express the function given in the form
Identify
and determine the period,
Draw the graph of
Use the reciprocal relationship between
and
to draw the graph of
Sketch the asymptotes.
Plot any two reference points and draw the graph through these points.
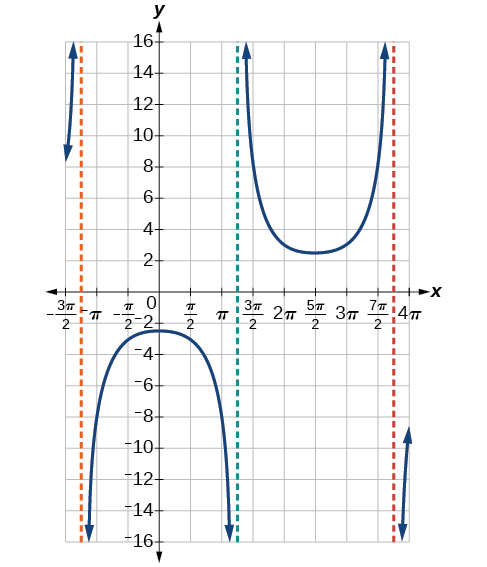
Graphing a variation of the cosecant function
Graph one period of
Step 1. The given function is already written in the general form,
Step 2.
so the stretching factor is 3.
Step 3.
so
The period is
units.
Step 4. Sketch the graph of the function
Step 5. Use the reciprocal relationship of the sine and cosecant functions to draw the
cosecant function .
Steps 6–7. Sketch three asymptotes at
and
We can use two reference points, the local maximum at
and the local minimum at
[link] shows the graph.
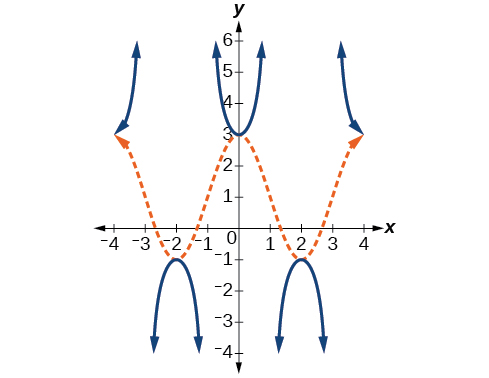
The last trigonometric function we need to explore is
cotangent . The cotangent is defined by the
reciprocal identity
Notice that the function is undefined when the tangent function is 0, leading to a vertical asymptote in the graph at
etc. Since the output of the tangent function is all real numbers, the output of the
cotangent function is also all real numbers.
We can graph
by observing the graph of the tangent function because these two functions are reciprocals of one another. See
[link] . Where the graph of the tangent function decreases, the graph of the cotangent function increases. Where the graph of the tangent function increases, the graph of the cotangent function decreases.
Questions & Answers
Ayele, K., 2003. Introductory Economics, 3rd ed., Addis Ababa.
what's the difference between a firm and an industry
Abdul
firm is the unit which transform inputs to output where as industry contain combination of firms with similar production 😅😅
Abdulraufu
Suppose the demand function that a firm faces shifted from
Qd 120 3P
to
Qd 90 3P
and the supply function has shifted from
QS
20 2P
to
QS
10 2P .
a) Find the effect of this change on price and quantity.
b) Which of the changes in demand and supply is higher?
Demand curve shows that how supply and others conditions affect on demand of a particular thing and what percent demand increase whith increase of supply of goods
Israr
Hi Sir please how do u calculate Cross elastic demand and income elastic demand?
Abari
Got questions? Join the online conversation and get instant answers!


![A graph of two periods of a modified cosine function. Range is [-1,3], graphed from x=-4 to x=4.](/ocw/mirror/col11667/m49389/CNX_Precalc_Figure_06_02_015.jpg)