Graph plane curves described by parametric equations by plotting points.
Graph parametric equations.
It is the bottom of the ninth inning, with two outs and two men on base. The home team is losing by two runs. The batter swings and hits the baseball at 140 feet per second and at an angle of approximately
to the horizontal. How far will the ball travel? Will it clear the fence for a game-winning home run? The outcome may depend partly on other factors (for example, the wind), but mathematicians can model the path of a projectile and predict approximately how far it will travel using
parametric equations . In this section, we’ll discuss parametric equations and some common applications, such as projectile motion problems.
Parametric equations can model the path of a projectile. (credit: Paul Kreher, Flickr)
Graphing parametric equations by plotting points
In lieu of a graphing calculator or a computer graphing program, plotting points to represent the graph of an equation is the standard method. As long as we are careful in calculating the values, point-plotting is highly dependable.
Given a pair of parametric equations, sketch a graph by plotting points.
Construct a table with three columns:
Evaluate
and
for values of
over the interval for which the functions are defined.
Plot the resulting pairs
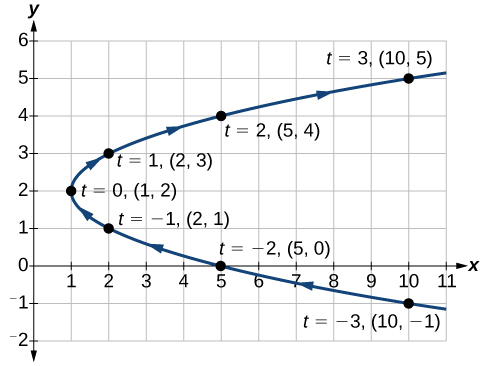
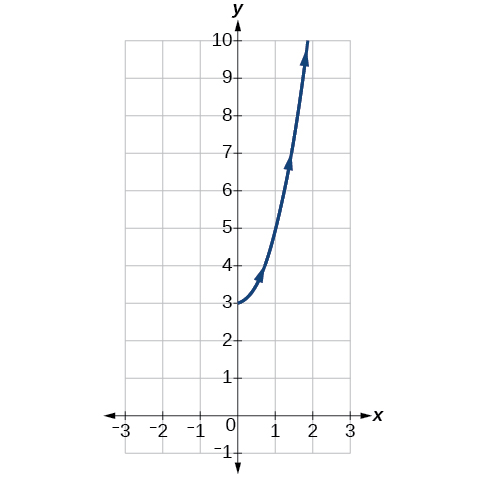
Sketching the graph of a pair of parametric equations by plotting points
Sketch the graph of the
parametric equations
Construct a table of values for
and
as in
[link] , and plot the points in a plane.
The graph is a
parabola with vertex at the point
opening to the right. See
[link] .
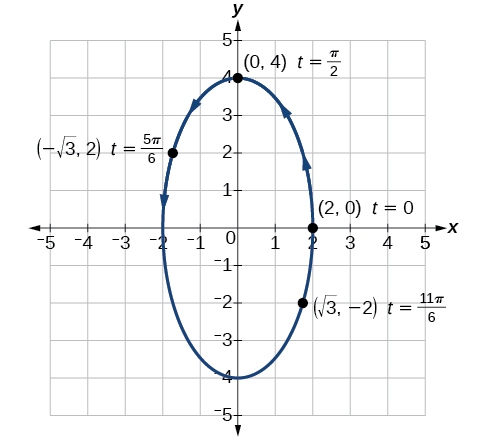
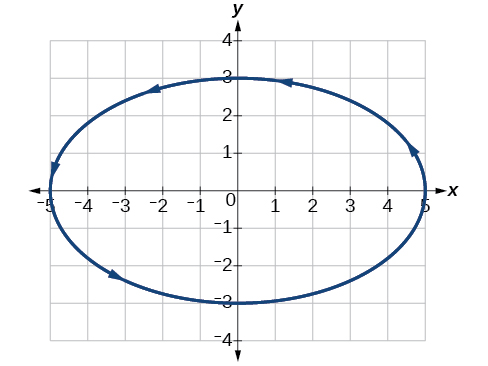
Sketching the graph of trigonometric parametric equations
Construct a table of values for the given parametric equations and sketch the graph:
Construct a table like that in
[link] using angle measure in radians as inputs for
and evaluating
and
Using angles with known sine and cosine values for
makes calculations easier.
By the symmetry shown in the values of
and
we see that the parametric equations represent an
ellipse . The
ellipse is mapped in a counterclockwise direction as shown by the arrows indicating increasing
values.
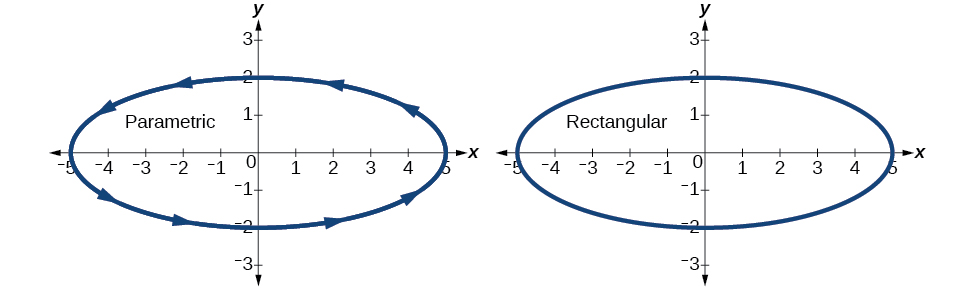
Graphing parametric equations and rectangular form together
Graph the parametric equations
and
First, construct the graph using data points generated from the
parametric form . Then graph the
rectangular form of the equation. Compare the two graphs.
Next, translate the parametric equations to rectangular form. To do this, we solve for
in either
or
and then substitute the expression for
in the other equation. The result will be a function
if solving for
as a function of
or
if solving for
as a function of
In economics, a perfect market refers to a theoretical construct where all participants have perfect information, goods are homogenous, there are no barriers to entry or exit, and prices are determined solely by supply and demand. It's an idealized model used for analysis,
When MP₁ becomes negative, TP start to decline.
Extuples Suppose that the short-run production function of certain cut-flower firm is given by: Q=4KL-0.6K2 - 0.112 •
Where is quantity of cut flower produced, I is labour input and K is fixed capital input (K-5). Determine the average product of lab
Kelo
Extuples Suppose that the short-run production function of certain cut-flower firm is given by: Q=4KL-0.6K2 - 0.112 •
Where is quantity of cut flower produced, I is labour input and K is fixed capital input (K-5). Determine the average product of labour (APL) and marginal product of labour (MPL)
Quantity demanded refers to the specific amount of a good or service that consumers are willing and able to purchase at a give price and within a specific time period. Demand, on the other hand, is a broader concept that encompasses the entire relationship between price and quantity demanded
Ezea
ok
Shukri
how do you save a country economic situation when it's falling apart
Economic growth as an increase in the production and consumption of goods and services within an economy.but
Economic development as a broader concept that encompasses not only economic growth but also social & human well being.
Shukri
production function means
Jabir
What do you think is more important to focus on when considering inequality ?
sir...I just want to ask one question... Define the term contract curve? if you are free please help me to find this answer 🙏
Asui
it is a curve that we get after connecting the pareto optimal combinations of two consumers after their mutually beneficial trade offs
Awais
thank you so much 👍 sir
Asui
In economics, the contract curve refers to the set of points in an Edgeworth box diagram where both parties involved in a trade cannot be made better off without making one of them worse off. It represents the Pareto efficient allocations of goods between two individuals or entities, where neither p
Cornelius
In economics, the contract curve refers to the set of points in an Edgeworth box diagram where both parties involved in a trade cannot be made better off without making one of them worse off. It represents the Pareto efficient allocations of goods between two individuals or entities,
Cornelius
Suppose a consumer consuming two commodities X and Y has
The following utility function u=X0.4 Y0.6. If the price of the X and Y are 2 and 3 respectively and income Constraint is birr 50.
A,Calculate quantities of x and y which maximize utility.
B,Calculate value of Lagrange multiplier.
C,Calculate quantities of X and Y consumed with a given price.
D,alculate optimum level of output .
the market for lemon has 10 potential consumers, each having an individual demand curve p=101-10Qi, where p is price in dollar's per cup and Qi is the number of cups demanded per week by the i th consumer.Find the market demand curve using algebra. Draw an individual demand curve and the market dema
suppose the production function is given by ( L, K)=L¼K¾.assuming capital is fixed find APL and MPL. consider the following short run production function:Q=6L²-0.4L³ a) find the value of L that maximizes output b)find the value of L that maximizes marginal product
Abdureman
Got questions? Join the online conversation and get instant answers!