<< Chapter < Page Chapter >> Page >
In this section, you will:
  • Find the derivative of a function.
  • Find instantaneous rates of change.
  • Find an equation of the tangent line to the graph of a function at a point.
  • Find the instantaneous velocity of a particle.

The average teen in the United States opens a refrigerator door an estimated 25 times per day. Supposedly, this average is up from 10 years ago when the average teenager opened a refrigerator door 20 times per day http://www.csun.edu/science/health/docs/tv&health.html Source provided. .

It is estimated that a television is on in a home 6.75 hours per day, whereas parents spend an estimated 5.5 minutes per day having a meaningful conversation with their children. These averages, too, are not the same as they were 10 years ago, when the television was on an estimated 6 hours per day in the typical household, and parents spent 12 minutes per day in meaningful conversation with their kids.

What do these scenarios have in common? The functions representing them have changed over time. In this section, we will consider methods of computing such changes over time.

Finding the average rate of change of a function

The functions describing the examples above involve a change over time. Change divided by time is one example of a rate. The rates of change in the previous examples are each different. In other words, some changed faster than others. If we were to graph the functions, we could compare the rates by determining the slopes of the graphs.

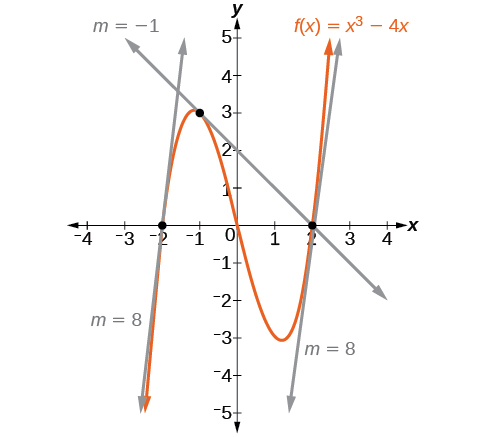
A tangent line    to a curve is a line that intersects the curve at only a single point but does not cross it there. (The tangent line may intersect the curve at another point away from the point of interest.) If we zoom in on a curve at that point, the curve appears linear, and the slope of the curve at that point is close to the slope of the tangent line at that point.

[link] represents the function f ( x ) = x 3 4 x . We can see the slope at various points along the curve.

  • slope at x = −2 is 8
  • slope at x = −1 is –1
  • slope at x = 2 is 8

Graph of f(x) = x^3 - 4x with tangent lines at x = -2 with a slope of 8, at x = -3 with a slope of -1, and at x=2 with a slope of 8.
Graph showing tangents to curve at –2, –1, and 2.

Let’s imagine a point on the curve of function f at x = a as shown in [link] . The coordinates of the point are ( a , f ( a ) ) . Connect this point with a second point on the curve a little to the right of x = a , with an x -value increased by some small real number h . The coordinates of this second point are ( a + h , f ( a + h ) ) for some positive-value h .

Graph of an increasing function that demonstrates the rate of change of the function by drawing a line between the two points, (a, f(a)) and (a, f(a+h)).
Connecting point a with a point just beyond allows us to measure a slope close to that of a tangent line at x = a .

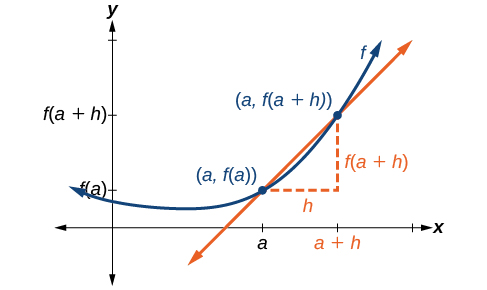
We can calculate the slope of the line connecting the two points ( a , f ( a ) ) and ( a + h , f ( a + h ) ) , called a secant line    , by applying the slope formula,

slope =  change in  y change in  x

slope =  change in  y change in  x

We use the notation m sec to represent the slope of the secant line connecting two points.

m sec = f ( a + h ) f ( a ) ( a + h ) ( a )         = f ( a + h ) f ( a ) a + h a

The slope m sec equals the average rate of change between two points ( a , f ( a ) ) and ( a + h , f ( a + h ) ) .

m sec = f ( a + h ) f ( a ) h

The average rate of change between two points on a curve

The average rate of change    (AROC) between two points ( a , f ( a ) ) and ( a + h , f ( a + h ) ) on the curve of f is the slope of the line connecting the two points and is given by

AROC = f ( a + h ) f ( a ) h

Questions & Answers

Ayele, K., 2003. Introductory Economics, 3rd ed., Addis Ababa.
Widad Reply
can you send the book attached ?
Ariel
?
Ariel
What is economics
Widad Reply
the study of how humans make choices under conditions of scarcity
AI-Robot
U(x,y) = (x×y)1/2 find mu of x for y
Desalegn Reply
U(x,y) = (x×y)1/2 find mu of x for y
Desalegn
what is ecnomics
Jan Reply
this is the study of how the society manages it's scarce resources
Belonwu
what is macroeconomic
John Reply
macroeconomic is the branch of economics which studies actions, scale, activities and behaviour of the aggregate economy as a whole.
husaini
etc
husaini
difference between firm and industry
husaini Reply
what's the difference between a firm and an industry
Abdul
firm is the unit which transform inputs to output where as industry contain combination of firms with similar production 😅😅
Abdulraufu
Suppose the demand function that a firm faces shifted from Qd  120 3P to Qd  90  3P and the supply function has shifted from QS  20  2P to QS 10  2P . a) Find the effect of this change on price and quantity. b) Which of the changes in demand and supply is higher?
Toofiq Reply
explain standard reason why economic is a science
innocent Reply
factors influencing supply
Petrus Reply
what is economic.
Milan Reply
scares means__________________ends resources. unlimited
Jan
economics is a science that studies human behaviour as a relationship b/w ends and scares means which have alternative uses
Jan
calculate the profit maximizing for demand and supply
Zarshad Reply
Why qualify 28 supplies
Milan
what are explicit costs
Nomsa Reply
out-of-pocket costs for a firm, for example, payments for wages and salaries, rent, or materials
AI-Robot
concepts of supply in microeconomics
David Reply
economic overview notes
Amahle Reply
identify a demand and a supply curve
Salome Reply
i don't know
Parul
there's a difference
Aryan
Demand curve shows that how supply and others conditions affect on demand of a particular thing and what percent demand increase whith increase of supply of goods
Israr
Hi Sir please how do u calculate Cross elastic demand and income elastic demand?
Abari
Got questions? Join the online conversation and get instant answers!
Jobilize.com Reply
Practice Key Terms 7

Get Jobilize Job Search Mobile App in your pocket Now!

Get it on Google Play Download on the App Store Now


Source:  OpenStax, Precalculus. OpenStax CNX. Jan 19, 2016 Download for free at https://legacy.cnx.org/content/col11667/1.6
Google Play and the Google Play logo are trademarks of Google Inc.

Notification Switch

Would you like to follow the 'Precalculus' conversation and receive update notifications?

Ask