Simulated NMR temperature domains of fluxional molecules. Reprinted with permission from F. P. Gasparro and N. H. Kolodny,
J. Chem. Ed. , 1977, 4, 258. Copyright: American Chemical Society (1977).
Diverse populations
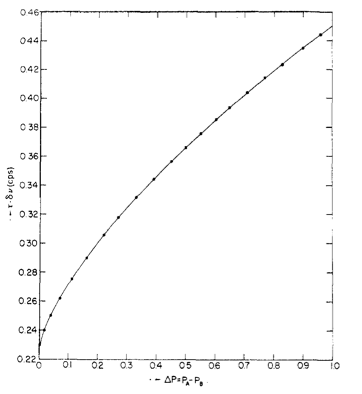
For unequal doublets (for instance, two protons exchanging with one proton), a different treatment is needed. The difference in population can be defined through
[link] , where P
i is the concentration (integration) of species i and X = 2π
Δv t (counts per second). Values for Δ
v t are given in
[link] .
Plot of Δ
v t versus ΔP. Reprinted with permission from H. Shanan-Atidi and K. H. Bar-Eli,
J. Phys. Chem. , 1970,
74 , 961. Copyright: American Chemical Society (1970).
The rates of conversion for the two species, k
a and k
b , follow k
a P
a = k
b P
b (equilibrium), and because k
a = 1/t
a and k
b = 1/t
b , the rate constant follows
[link] .
From Eyring’s expressions, the Gibbs free activation energy for each species can be obtained through
[link] and
[link]
Taking the difference of
[link] and
[link] gives the difference in energy between species a and b (
[link] ).
Converting constants will yield the following activation energies in calories per mole (
[link] and
[link] ).
To obtain the free energys of activation, values of log (X/(2π(1 + ΔP))) need to be plotted against ΔP (values T
c and Δ
v0 are predetermined).
This unequal doublet energetics approximation only gives ΔG
‡ at one temperature, and a more rigorous theoretical treatment is needed to give information about ΔS
‡ and ΔH
‡ .
Example of determination of energetic parameters
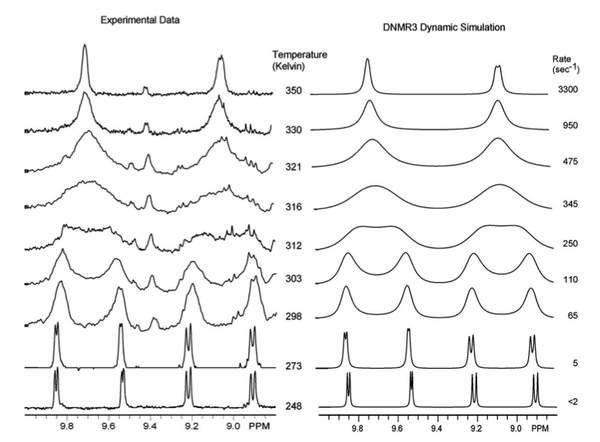
Normally ligands such as dipyrido(2,3-a;3′,2′-j)phenazine (dpop’) are tridentate when complexed to transition metal centers. However, dpop’ binds to rhenium in a bidentate manner, with the outer nitrogens alternating in being coordinated and uncoordinated. See
[link] for the structure of Re(CO)
3 (dpop')Cl. This fluxionality results in the exchange of the aromatic protons on the dpop’ ligand, which can be observed via
1 HNMR. Because of the complex nature of the coalescence of doublets, the rate constants at different temperatures were determined via computer simulation (DNMR3, a plugin of Topspin). These spectra are shown in
[link] .
The structure of Re(CO)
3 (dpop’)Cl. Reprinted with permission from K. D. Zimmera, R. Shoemakerb, and R. R. Ruminski,
Inorg. Chim. Acta. , 2006,
5 , 1478. Copyright: Elsevier (2006).experimental and simulated
1 HNMR spectra for Re(CO)
3 (dpop’)Cl. Reprinted with permission from K. D. Zimmera, R. Shoemakerb, and R. R. Ruminski,
Inorg. Chim. Acta. , 2006,
5 , 1478. Copyright: Elsevier (2006).
The activation parameters can then be obtained by plotting ln(k/T) versus 1/T (see
[link] for the Eyring plot). ΔS
‡ can be extracted from the y-intercept, and ΔH
‡ can be obtained through the slope of the plot. For this example, ΔH
‡ , ΔS
‡ and ΔG
‡ . were determined to be 64.9 kJ/mol, 7.88 J/mol, and 62.4 kJ/mol.
Eyring plot of ln(k/T) versus 1/T for Re(CO)
3 (dpop’)Cl. Adapted from K. D. Zimmera, R. Shoemakerb, and R. R. Ruminski,
Inorg. Chim. Acta , 2006,
5 , 1478. Copyright: Elsevier (2006).
Limitations to the approach
Though NMR is a powerful technique for determining the energetics of fluxional molecules, it does have one major limitation. If the fluctuation is too rapid for the NMR timescale (<1 ms) or if the conformational change is too slow meaning the coalescence temperature is not observed, the energetics cannot be calculated. In other words, spectra at coalescence and at no exchange need to be observable. One is also limited by the capabilities of the available spectrometer. The energetics of very fast fluxionality (metallocenes, PF
5 , etc) and very slow fluxionality may not be determinable. Also note that this method does not prove any fluxionality or any mechanism thereof; it only gives a value for the activation energy of the process. As a side note, sometimes the coalescence of NMR peaks is not due to fluxionality, but rather temperature-dependent chemical shifts.
Bibliography
H. S. Gutowsky and C. J. Hoffmann,
J. Chem. Phys. , 1951,
19 , 1259.
H. Nakazawa, K. Kawamura, K. Kubo, and K. Miyoshi,
Organometallics , 1999,
18 , 2961.
C. Raynaud, L. Maron, J. P. Daudey, and F. Jolibois.
ChemPhysChem, 2006, 7, 407.
F. P. Gasparro and N. H. Kolodny,
J. Chem. Ed. , 1977,
4 , 258.
B. Kersting, J. R. Telford, M. Meyer, and K. N. Raymond,
J. Am. Chem. Soc. , 1996,
118 , 5712.
M. J. Bennett Jr., F. A. Cotton, A. Davison, J. W. Faller, S. J. Lippard, and S. M. Morehouse,
J. Am. Chem. Soc., 1966,
88 , 4371.
H. Shanan-Atidi and K. H. Bar-Eli,
J. Phys. Chem. , 1970,
74 , 961.
D. J. Press, N. M. R. McNeil, A. Rauk, and T. G. Back,
J. Org. Chem. , 2012,
77 , 9268.
B. D. Nageswara Rao,
Meth. Enzymol. , 1989,
176 , 279.
K. D. Zimmera, R. Shoemakerb, and R. R. Ruminski,
Inorg. Chim. Acta , 2006,
5 , 1478.
Questions & Answers
differentiate between demand and supply
giving examples
In economics, a perfect market refers to a theoretical construct where all participants have perfect information, goods are homogenous, there are no barriers to entry or exit, and prices are determined solely by supply and demand. It's an idealized model used for analysis,
When MP₁ becomes negative, TP start to decline.
Extuples Suppose that the short-run production function of certain cut-flower firm is given by: Q=4KL-0.6K2 - 0.112 •
Where is quantity of cut flower produced, I is labour input and K is fixed capital input (K-5). Determine the average product of lab
Kelo
Extuples Suppose that the short-run production function of certain cut-flower firm is given by: Q=4KL-0.6K2 - 0.112 •
Where is quantity of cut flower produced, I is labour input and K is fixed capital input (K-5). Determine the average product of labour (APL) and marginal product of labour (MPL)
Quantity demanded refers to the specific amount of a good or service that consumers are willing and able to purchase at a give price and within a specific time period. Demand, on the other hand, is a broader concept that encompasses the entire relationship between price and quantity demanded
Ezea
ok
Shukri
how do you save a country economic situation when it's falling apart
Economic growth as an increase in the production and consumption of goods and services within an economy.but
Economic development as a broader concept that encompasses not only economic growth but also social & human well being.
Shukri
production function means
Jabir
What do you think is more important to focus on when considering inequality ?
sir...I just want to ask one question... Define the term contract curve? if you are free please help me to find this answer 🙏
Asui
it is a curve that we get after connecting the pareto optimal combinations of two consumers after their mutually beneficial trade offs
Awais
thank you so much 👍 sir
Asui
In economics, the contract curve refers to the set of points in an Edgeworth box diagram where both parties involved in a trade cannot be made better off without making one of them worse off. It represents the Pareto efficient allocations of goods between two individuals or entities, where neither p
Cornelius
In economics, the contract curve refers to the set of points in an Edgeworth box diagram where both parties involved in a trade cannot be made better off without making one of them worse off. It represents the Pareto efficient allocations of goods between two individuals or entities,
Cornelius
Suppose a consumer consuming two commodities X and Y has
The following utility function u=X0.4 Y0.6. If the price of the X and Y are 2 and 3 respectively and income Constraint is birr 50.
A,Calculate quantities of x and y which maximize utility.
B,Calculate value of Lagrange multiplier.
C,Calculate quantities of X and Y consumed with a given price.
D,alculate optimum level of output .
the market for lemon has 10 potential consumers, each having an individual demand curve p=101-10Qi, where p is price in dollar's per cup and Qi is the number of cups demanded per week by the i th consumer.Find the market demand curve using algebra. Draw an individual demand curve and the market dema
suppose the production function is given by ( L, K)=L¼K¾.assuming capital is fixed find APL and MPL. consider the following short run production function:Q=6L²-0.4L³ a) find the value of L that maximizes output b)find the value of L that maximizes marginal product
Receive real-time job alerts and never miss the right job again
Source:
OpenStax, Physical methods in chemistry and nano science. OpenStax CNX. May 05, 2015 Download for free at http://legacy.cnx.org/content/col10699/1.21
Google Play and the Google Play logo are trademarks of Google Inc.
Notification Switch
Would you like to follow the 'Physical methods in chemistry and nano science' conversation and receive update notifications?