

| << Chapter < Page | Chapter >> Page > |

There are two common methods for exciting the core electrons off the surface atoms. The first is to use a high-energy electron beam like the one in a scanning electron microscope (SEM). The beam is produced by an electron gun, in which electrons emitted thermionically from a hot cathode are guided down the column by an electric field and focused by a series of negatively charged “lenses.” X-rays emitted by the sample strike a lithium-drifted silicon p-i-n junction plate. This promotes electrons in the plate into the conduction band, inducing a voltage proportional to the energy of the impacting X-ray which generally falls between about 1 and 10 keV. The detector is cooled to liquid nitrogen temperatures to reduce electronic noise from thermal excitations.
It is also possible to use X-rays to excite the core electrons to the point of ionization. In this variation, known as energy-dispersive X-ray fluorescence analysis (EDXRFA or XRF), the electron column is replaced by an X-ray tube and the X-rays emitted by the sample in response to the bombardment are called secondary X-rays, but these variants are otherwise identical.
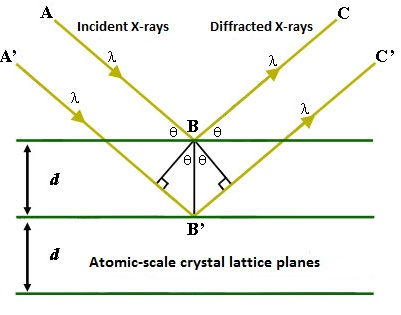
Regardless of the excitation method, subsequent interactions between the emitted X-rays and the sample can lead to poor resolution in the X-ray spectrum, producing a Gaussian-like curve instead of a sharp peak. Indeed, this spreading of energy within the sample combined with the penetration of the electron or X-ray beam leads to the analysis of a roughly 1 µm 3 volume instead of only the surface features. Peak broadening can lead to overlapping peaks and a generally misleading spectrum. In cases where a normal EDS spectrum is inadequately resolved, a technique called wavelength-dispersive X-ray spectroscopy (WDS) can be used. The required instrument is very similar to the ones discussed above, and can use either excitation method. The major difference is that instead of having the X-rays emitted by the sample hit the detector directly, they first encounter an analytical crystal of know lattice dimensions. Bragg’s law predicts that the strongest reflections off the crystal will occur for wavelengths such that the path difference between a rays reflecting from consecutive layers in the lattice is equal to an integral number of wavelengths. This is represented mathematically as [link] , where n is an integer, λ is the wavelength of impinging light, d is the distance between layers in the lattice, and θ is the angle of incidence. The relevant variables for the equation are labeled in [link] .
Notification Switch
Would you like to follow the 'Physical methods in chemistry and nano science' conversation and receive update notifications?

|
|

|
|

|
|

|
|

|
|

|
|
|
|
|

|
|
|
|
|

|