<< Chapter < Page Chapter >> Page >
The Moseley plot of characteristic X rays shows a plot of the atomic number as a function of the square root of the frequencies in Hertz divided by 10 to the 16. The vertical scale goes from 0 to 80 and labels the elements whose atomic number are a multiple of 5: P, C a, M n, Z n, B r, Z r, R h, S n, C s, N d, T b, Y b, and R e. The horizontal scale goes from 0 to 24. The data falls along several straight lines, corresponding to the series. The L series, in blue, lies above the K series, in red and all the L lines are steeper than the K lines. The L sub alpha series has the steepest slope of the L series. Two K series curves are shown, with the K sub alpha slope slightly steeper than the K sub beta slope.
A Moseley plot. These data were adapted from Moseley’s original data (H. G. J. Moseley, Philos. Mag . (6) 77:703, 1914).

Characteristic x-ray energy

Calculate the approximate energy of a K α X-ray from a tungsten anode in an X-ray tube.

Strategy

Two electrons occupy a filled K shell. A vacancy in this shell would leave one electron, so the effective charge for an electron in the L shell would be Z − 1 rather than Z . For tungsten, Z = 74 , so the effective charge is 73. This number can be used to calculate the energy-level difference between the L and K shells, and, therefore, the energy carried away by a photon in the transition L K .

Solution

The effective Z is 73, so the K α X-ray energy is given by

E K α = Δ E = E i E f = E 2 E 1 ,

where

E 1 = Z 2 1 2 E 0 = 73 2 1 ( 13.6 eV ) = −72.5 keV

and

E 2 = Z 2 2 2 E 0 = 73 2 4 ( 13.6 eV ) = −18.1 keV .

Thus,

E K α = −18.1 keV ( −72.5 keV ) = 54.4 keV .

Significance

This large photon energy is typical of X-rays. X-ray energies become progressively larger for heavier elements because their energy increases approximately as Z 2 . An acceleration voltage of more than 50,000 volts is needed to “knock out” an inner electron from a tungsten atom.

Got questions? Get instant answers now!

X-ray technology

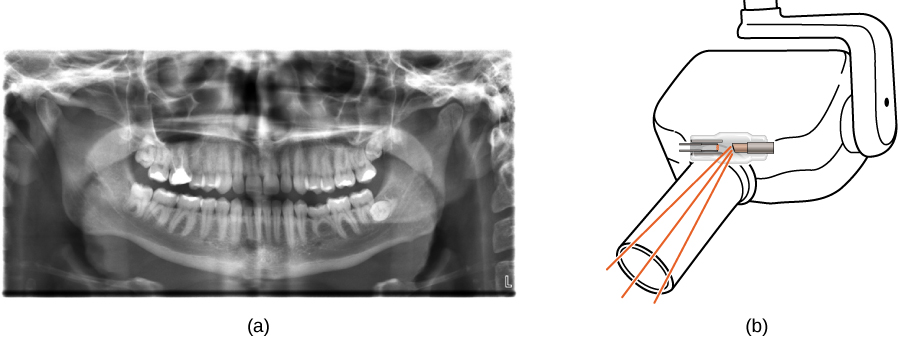
X-rays have many applications, such as in medical diagnostics ( [link] ), inspection of luggage at airports ( [link] ), and even detection of cracks in crucial aircraft components. The most common X-ray images are due to shadows. Because X-ray photons have high energy, they penetrate materials that are opaque to visible light. The more energy an X-ray photon has, the more material it penetrates. The depth of penetration is related to the density of the material, as well as to the energy of the photon. The denser the material, the fewer X-ray photons get through and the darker the shadow. X-rays are effective at identifying bone breaks and tumors; however, overexposure to X-rays can damage cells in biological organisms.

Figure (a) shows an X-ray image of front view of the jaw, especially the teeth. Figure (b) shows a drawing of an dental x ray machine.
(a) An X-ray image of a person’s teeth. (b) A typical X-ray machine in a dentist’s office produces relatively low-energy radiation to minimize patient exposure. (credit a: modification of work by “Dmitry G”/Wikimedia Commons)
A colored X-ray image of a piece of luggage.
An X-ray image of a piece of luggage. The denser the material, the darker the shadow. Object colors relate to material composition—metallic objects show up as blue in this image. (credit: “IDuke”/Wikimedia Commons)

A standard X-ray image provides a two-dimensional view of the object. However, in medical applications, this view does not often provide enough information to draw firm conclusions. For example, in a two-dimensional X-ray image of the body, bones can easily hide soft tissues or organs. The CAT (computed axial tomography) scanner addresses this problem by collecting numerous X-ray images in “slices” throughout the body. Complex computer-image processing of the relative absorption of the X-rays, in different directions, can produce a highly detailed three-dimensional X-ray image of the body.

X-rays can also be used to probe the structures of atoms and molecules. Consider X-rays incident on the surface of a crystalline solid. Some X-ray photons reflect at the surface, and others reflect off the “plane” of atoms just below the surface. Interference between these photons, for different angles of incidence, produces a beautiful image on a screen ( [link] ). The interaction of X-rays with a solid is called X-ray diffraction. The most famous example using X-ray diffraction is the discovery of the double-helix structure of DNA.

Questions & Answers

Ayele, K., 2003. Introductory Economics, 3rd ed., Addis Ababa.
Widad Reply
can you send the book attached ?
Ariel
?
Ariel
What is economics
Widad Reply
the study of how humans make choices under conditions of scarcity
AI-Robot
U(x,y) = (x×y)1/2 find mu of x for y
Desalegn Reply
U(x,y) = (x×y)1/2 find mu of x for y
Desalegn
what is ecnomics
Jan Reply
this is the study of how the society manages it's scarce resources
Belonwu
what is macroeconomic
John Reply
macroeconomic is the branch of economics which studies actions, scale, activities and behaviour of the aggregate economy as a whole.
husaini
etc
husaini
difference between firm and industry
husaini Reply
what's the difference between a firm and an industry
Abdul
firm is the unit which transform inputs to output where as industry contain combination of firms with similar production 😅😅
Abdulraufu
Suppose the demand function that a firm faces shifted from Qd  120 3P to Qd  90  3P and the supply function has shifted from QS  20  2P to QS 10  2P . a) Find the effect of this change on price and quantity. b) Which of the changes in demand and supply is higher?
Toofiq Reply
explain standard reason why economic is a science
innocent Reply
factors influencing supply
Petrus Reply
what is economic.
Milan Reply
scares means__________________ends resources. unlimited
Jan
economics is a science that studies human behaviour as a relationship b/w ends and scares means which have alternative uses
Jan
calculate the profit maximizing for demand and supply
Zarshad Reply
Why qualify 28 supplies
Milan
what are explicit costs
Nomsa Reply
out-of-pocket costs for a firm, for example, payments for wages and salaries, rent, or materials
AI-Robot
concepts of supply in microeconomics
David Reply
economic overview notes
Amahle Reply
identify a demand and a supply curve
Salome Reply
i don't know
Parul
there's a difference
Aryan
Demand curve shows that how supply and others conditions affect on demand of a particular thing and what percent demand increase whith increase of supply of goods
Israr
Hi Sir please how do u calculate Cross elastic demand and income elastic demand?
Abari
Got questions? Join the online conversation and get instant answers!
Jobilize.com Reply
Practice Key Terms 5

Get Jobilize Job Search Mobile App in your pocket Now!

Get it on Google Play Download on the App Store Now


Source:  OpenStax, University physics volume 3. OpenStax CNX. Nov 04, 2016 Download for free at http://cnx.org/content/col12067/1.4
Google Play and the Google Play logo are trademarks of Google Inc.

Notification Switch

Would you like to follow the 'University physics volume 3' conversation and receive update notifications?

Ask