

| << Chapter < Page | Chapter >> Page > |
where is the Madelung constant, introduced earlier. From this analysis, we can see that this constant is the infinite converging sum
Distant ions make a significant contribution to this sum, so it converges slowly, and many terms must be used to calculate accurately. For all FCC ionic solids, is approximately 1.75.
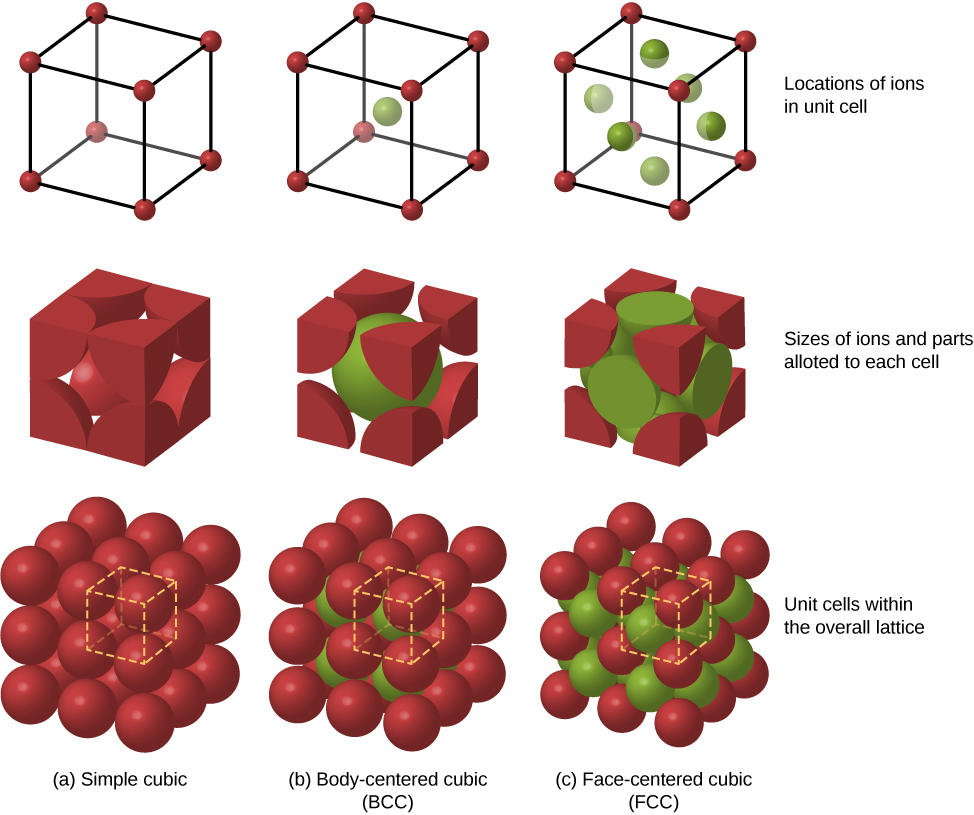
Other possible packing arrangements of atoms in solids include simple cubic and body-centered cubic (BCC) . These three different packing structures of solids are compared in [link] . The first row represents the location, but not the size, of the ions; the second row indicates the unit cells of each structure or lattice; and the third row represents the location and size of the ions. The BCC structure has eight nearest neighbors, with a Madelung constant of about 1.76—only slightly different from that for the FCC structure. Determining the Madelung constant for specific solids is difficult work and the subject of current research.
The energy of the sodium ions is not entirely due to attractive forces between oppositely charged ions. If the ions are bought too close together, the wave functions of core electrons of the ions overlap, and the electrons repel due to the exclusion principle. The total potential energy of the ion is therefore the sum of the attractive Coulomb potential and the repulsive potential associated with the exclusion principle Calculating this repulsive potential requires powerful computers. Fortunately, however, this energy can be described accurately by a simple formula that contains adjustable parameters:
where the parameters A and n are chosen to give predictions consistent with experimental data. For the problem at the end of this chapter, the parameter n is referred to as the repulsion constant . The total potential energy of the ion is therefore
At equilibrium, there is no net force on the ion, so the distance between neighboring and ions must be the value for which U is a minimum. Setting , we have
Thus,
Inserting this expression into the expression for the total potential energy, we have
Notice that the total potential energy now has only one adjustable parameter, n . The parameter A has been replaced by a function involving , the equilibrium separation distance, which can be measured by a diffraction experiment (you learned about diffraction in a previous chapter). The total potential energy is plotted in [link] for , the approximate value of n for NaCl.
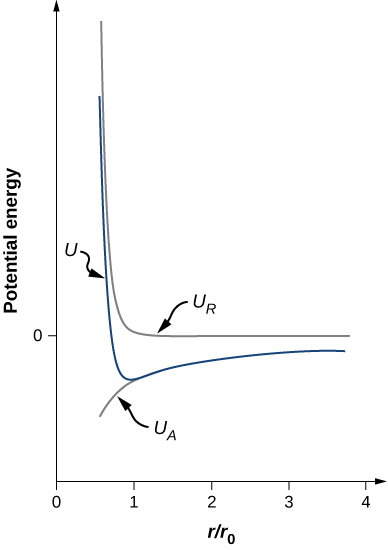
As long as , the curve for U has the same general shape: U approaches infinity as and U approaches zero as . The minimum value of the potential energy is given by
Notification Switch
Would you like to follow the 'University physics volume 3' conversation and receive update notifications?

|
|

|
|

|
|

|
|

|
|

|
|

|
|

|
|

|
|

|