<< Chapter < Page Chapter >> Page >
By the end of this section, you will be able to:
  • Describe the statistical interpretation of the wave function
  • Use the wave function to determine probabilities
  • Calculate expectation values of position, momentum, and kinetic energy

In the preceding chapter, we saw that particles act in some cases like particles and in other cases like waves. But what does it mean for a particle to “act like a wave”? What precisely is “waving”? What rules govern how this wave changes and propagates? How is the wave function used to make predictions? For example, if the amplitude of an electron wave is given by a function of position and time, Ψ ( x , t ) , defined for all x , where exactly is the electron? The purpose of this chapter is to answer these questions.

Using the wave function

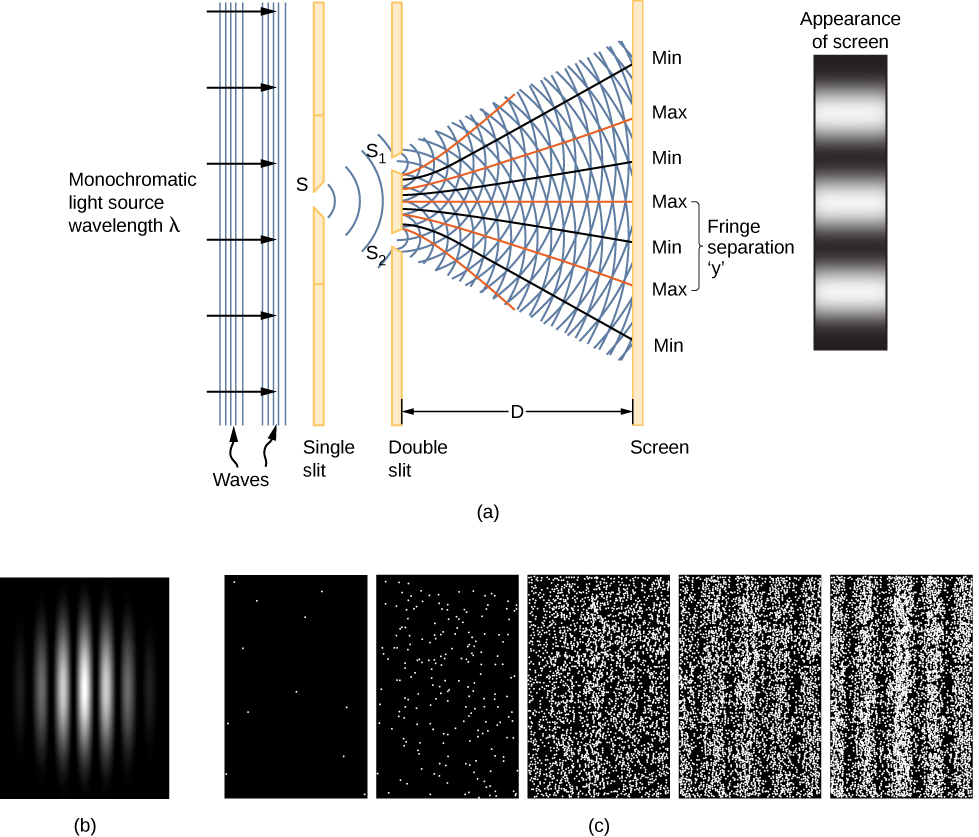
A clue to the physical meaning of the wave function Ψ ( x , t ) is provided by the two-slit interference of monochromatic light ( [link] ). (See also Electromagnetic Waves and Interference .) The wave function    of a light wave is given by E ( x , t ), and its energy density is given by | E | 2 , where E is the electric field strength. The energy of an individual photon depends only on the frequency of light, ε photon = h f , so | E | 2 is proportional to the number of photons. When light waves from S 1 interfere with light waves from S 2 at the viewing screen (a distance D away), an interference pattern is produced (part (a) of the figure). Bright fringes correspond to points of constructive interference of the light waves, and dark fringes correspond to points of destructive interference of the light waves (part (b)).

Suppose the screen is initially unexposed to light. If the screen is exposed to very weak light, the interference pattern appears gradually ( [link] (c), left to right). Individual photon hits on the screen appear as dots. The dot density is expected to be large at locations where the interference pattern will be, ultimately, the most intense. In other words, the probability (per unit area) that a single photon will strike a particular spot on the screen is proportional to the square of the total electric field, | E | 2 at that point. Under the right conditions, the same interference pattern develops for matter particles, such as electrons.

Part a shows monochromatic light of wavelength lambda emitted from a source, arriving as plane waves at a single slit, S. The waves pass through the slit ad form circular waves that arrive at a double slit, S sub 1 and S sub 2. The light rays emerge from two slits as semicircles overlapping one another. The interacting waves spread out and end on a screen where points of maximum, where the crests or troughs overlap, and minimum, where the crests from one slit overlap the troughs from the other, are marked. The pattern appears on the screen as a series of alternating bright and dark fringes. The fringes separation, y, is the distance between adjacent maxima. In part b, a photograph of the fringe pattern is shown. Part c shows how the pattern develops in time. Photos of the image at five times are shown. At first, only a few scattered bright points appear, apparently randomly, against a dark background. In the second image, we see more dots but not yet any discernible pattern. In the third image, we start to see that there are more dots in some parts of the image and fewer elsewhere. Vertical stripes of dense bright dots separated are clearly seen in the fourth image, and even more clearly in the fifth.
Two-slit interference of monochromatic light. (a) Schematic of two-slit interference; (b) light interference pattern; (c) interference pattern built up gradually under low-intensity light (left to right).

Visit this interactive simulation to learn more about quantum wave interference.

The square of the matter wave | Ψ | 2 in one dimension has a similar interpretation as the square of the electric field | E | 2 . It gives the probability that a particle will be found at a particular position and time per unit length, also called the probability density    . The probability ( P ) a particle is found in a narrow interval ( x , x + dx ) at time t is therefore

P ( x , x + d x ) = | Ψ ( x , t ) | 2 d x .

(Later, we define the magnitude squared for the general case of a function with “imaginary parts.”) This probabilistic interpretation of the wave function is called the Born interpretation    . Examples of wave functions and their squares for a particular time t are given in [link] .

Questions & Answers

differentiate between demand and supply giving examples
Lambiv Reply
differentiated between demand and supply using examples
Lambiv
what is labour ?
Lambiv
how will I do?
Venny Reply
how is the graph works?I don't fully understand
Rezat Reply
information
Eliyee
devaluation
Eliyee
t
WARKISA
hi guys good evening to all
Lambiv
multiple choice question
Aster Reply
appreciation
Eliyee
explain perfect market
Lindiwe Reply
In economics, a perfect market refers to a theoretical construct where all participants have perfect information, goods are homogenous, there are no barriers to entry or exit, and prices are determined solely by supply and demand. It's an idealized model used for analysis,
Ezea
What is ceteris paribus?
Shukri Reply
other things being equal
AI-Robot
When MP₁ becomes negative, TP start to decline. Extuples Suppose that the short-run production function of certain cut-flower firm is given by: Q=4KL-0.6K2 - 0.112 • Where is quantity of cut flower produced, I is labour input and K is fixed capital input (K-5). Determine the average product of lab
Kelo
Extuples Suppose that the short-run production function of certain cut-flower firm is given by: Q=4KL-0.6K2 - 0.112 • Where is quantity of cut flower produced, I is labour input and K is fixed capital input (K-5). Determine the average product of labour (APL) and marginal product of labour (MPL)
Kelo
yes,thank you
Shukri
Can I ask you other question?
Shukri
what is monopoly mean?
Habtamu Reply
What is different between quantity demand and demand?
Shukri Reply
Quantity demanded refers to the specific amount of a good or service that consumers are willing and able to purchase at a give price and within a specific time period. Demand, on the other hand, is a broader concept that encompasses the entire relationship between price and quantity demanded
Ezea
ok
Shukri
how do you save a country economic situation when it's falling apart
Lilia Reply
what is the difference between economic growth and development
Fiker Reply
Economic growth as an increase in the production and consumption of goods and services within an economy.but Economic development as a broader concept that encompasses not only economic growth but also social & human well being.
Shukri
production function means
Jabir
What do you think is more important to focus on when considering inequality ?
Abdisa Reply
any question about economics?
Awais Reply
sir...I just want to ask one question... Define the term contract curve? if you are free please help me to find this answer 🙏
Asui
it is a curve that we get after connecting the pareto optimal combinations of two consumers after their mutually beneficial trade offs
Awais
thank you so much 👍 sir
Asui
In economics, the contract curve refers to the set of points in an Edgeworth box diagram where both parties involved in a trade cannot be made better off without making one of them worse off. It represents the Pareto efficient allocations of goods between two individuals or entities, where neither p
Cornelius
In economics, the contract curve refers to the set of points in an Edgeworth box diagram where both parties involved in a trade cannot be made better off without making one of them worse off. It represents the Pareto efficient allocations of goods between two individuals or entities,
Cornelius
Suppose a consumer consuming two commodities X and Y has The following utility function u=X0.4 Y0.6. If the price of the X and Y are 2 and 3 respectively and income Constraint is birr 50. A,Calculate quantities of x and y which maximize utility. B,Calculate value of Lagrange multiplier. C,Calculate quantities of X and Y consumed with a given price. D,alculate optimum level of output .
Feyisa Reply
Answer
Feyisa
c
Jabir
the market for lemon has 10 potential consumers, each having an individual demand curve p=101-10Qi, where p is price in dollar's per cup and Qi is the number of cups demanded per week by the i th consumer.Find the market demand curve using algebra. Draw an individual demand curve and the market dema
Gsbwnw Reply
suppose the production function is given by ( L, K)=L¼K¾.assuming capital is fixed find APL and MPL. consider the following short run production function:Q=6L²-0.4L³ a) find the value of L that maximizes output b)find the value of L that maximizes marginal product
Abdureman
types of unemployment
Yomi Reply
What is the difference between perfect competition and monopolistic competition?
Mohammed
Got questions? Join the online conversation and get instant answers!
Jobilize.com Reply

Get Jobilize Job Search Mobile App in your pocket Now!

Get it on Google Play Download on the App Store Now


Source:  OpenStax, University physics volume 3. OpenStax CNX. Nov 04, 2016 Download for free at http://cnx.org/content/col12067/1.4
Google Play and the Google Play logo are trademarks of Google Inc.

Notification Switch

Would you like to follow the 'University physics volume 3' conversation and receive update notifications?

Ask