<< Chapter < Page Chapter >> Page >
This graph shows the variation of blackbody Radiation intensity with wavelengths expressed in micrometers. Five curves that correspond to 2000 K, 3000 K, 4000 K, and 5000 K are drawn. The maximum of the radiation intensity shifts to the short-wavelength side with increase in temperature. It is in in the far-infrared for 2000 K, near infrared for 3000 K, red part of the visible spectrum for 4000 K, and green part of the visible spectrum for 5000 K.
The intensity of blackbody radiation versus the wavelength of the emitted radiation. Each curve corresponds to a different blackbody temperature, starting with a low temperature (the lowest curve) to a high temperature (the highest curve).
Graph shows the variation of Radiation intensity with wavelength for radiation emitted from a quartz surface and the blackbody radiation emitted at 600 K. Both spectra exhibit infrared peak at around 4 micrometers. However, while the intensity of blackbody radiation gradually decreases with temperature, the intensity of radiation emitted from quartz surface decreases much faster and then shows a second peak around 10 micrometers.
The spectrum of radiation emitted from a quartz surface (blue curve) and the blackbody radiation curve (black curve) at 600 K.

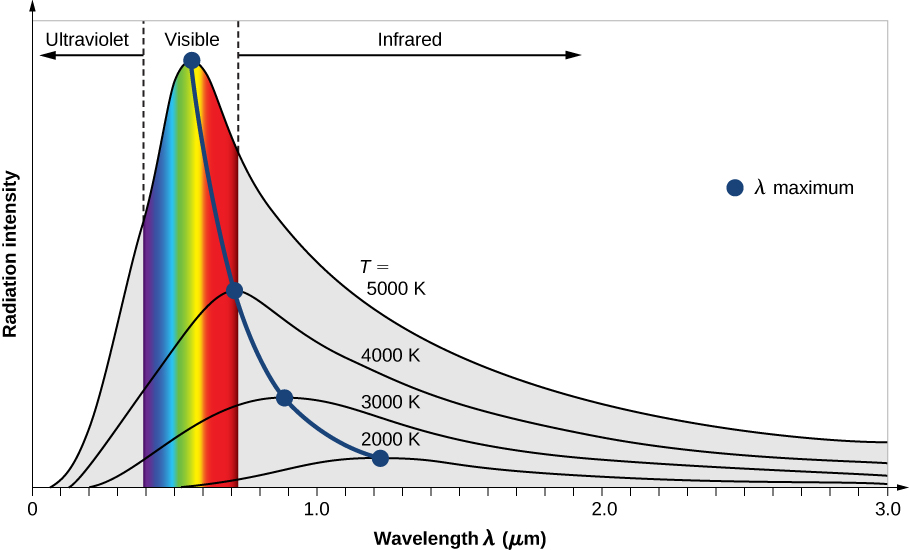
Two important laws summarize the experimental findings of blackbody radiation: Wien’s displacement law and Stefan’s law . Wien’s displacement law is illustrated in [link] by the curve connecting the maxima on the intensity curves. In these curves, we see that the hotter the body, the shorter the wavelength corresponding to the emission peak in the radiation curve. Quantitatively, Wien’s law reads
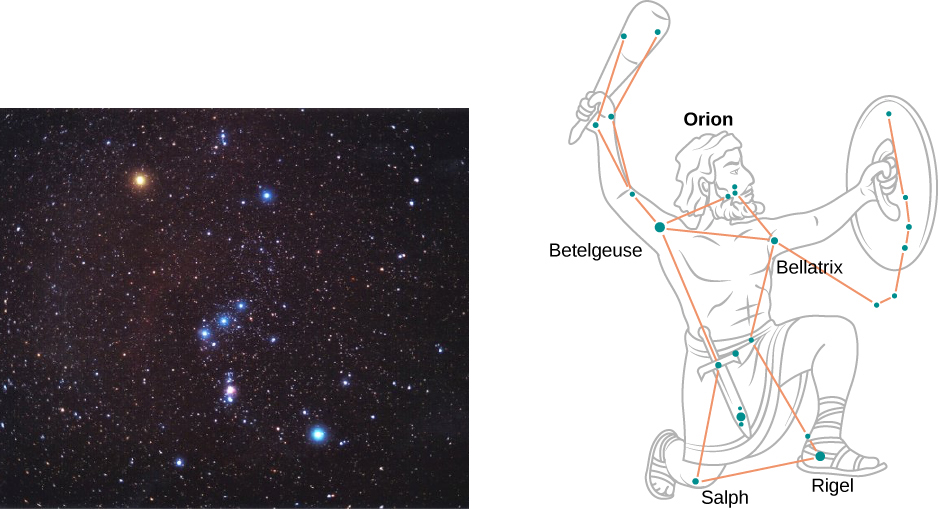
λ max T = 2.898 × 10 −3 m · K

where λ max is the position of the maximum in the radiation curve. In other words, λ max is the wavelength at which a blackbody radiates most strongly at a given temperature T . Note that in [link] , the temperature is in kelvins. Wien’s displacement law allows us to estimate the temperatures of distant stars by measuring the wavelength of radiation they emit.

Temperatures of distant stars

On a clear evening during the winter months, if you happen to be in the Northern Hemisphere and look up at the sky, you can see the constellation Orion (The Hunter). One star in this constellation, Rigel , flickers in a blue color and another star, Betelgeuse , has a reddish color, as shown in [link] . Which of these two stars is cooler, Betelgeuse or Rigel?

Strategy

We treat each star as a blackbody. Then according to Wien’s law, its temperature is inversely proportional to the wavelength of its peak intensity. The wavelength λ max (blue) of blue light is shorter than the wavelength λ max (red) of red light. Even if we do not know the precise wavelengths, we can still set up a proportion.

Solution

Writing Wien’s law for the blue star and for the red star, we have

λ max (red) T (red) = 2.898 × 10 −3 m · K = λ max (blue) T (blue)

When simplified, [link] gives

T (red) = λ max (blue) λ max (red) T (blue) < T (blue)

Therefore, Betelgeuse is cooler than Rigel.

Significance

Note that Wien’s displacement law tells us that the higher the temperature of an emitting body, the shorter the wavelength of the radiation it emits. The qualitative analysis presented in this example is generally valid for any emitting body, whether it is a big object such as a star or a small object such as the glowing filament in an incandescent lightbulb.

Got questions? Get instant answers now!

Check Your Understanding The flame of a peach-scented candle has a yellowish color and the flame of a Bunsen’s burner in a chemistry lab has a bluish color. Which flame has a higher temperature?

Bunsen’s burner

Got questions? Get instant answers now!
The picture on the left is a photograph of the Orion constellation with the red star to the left top corner. The picture on the right is a drawing of the Orion constellation depicted as an ancient warrior.
In the Orion constellation, the red star Betelgeuse, which usually takes on a yellowish tint, appears as the figure’s right shoulder (in the upper left). The giant blue star on the bottom right is Rigel, which appears as the hunter’s left foot. (credit left: modification of work by NASA c/o Matthew Spinelli)

The second experimental relation is Stefan’s law , which concerns the total power of blackbody radiation emitted across the entire spectrum of wavelengths at a given temperature. In [link] , this total power is represented by the area under the blackbody radiation curve for a given T . As the temperature of a blackbody increases, the total emitted power also increases. Quantitatively, Stefan’s law expresses this relation as

Practice Key Terms 9

Get Jobilize Job Search Mobile App in your pocket Now!

Get it on Google Play Download on the App Store Now


Source:  OpenStax, University physics volume 3. OpenStax CNX. Nov 04, 2016 Download for free at http://cnx.org/content/col12067/1.4
Google Play and the Google Play logo are trademarks of Google Inc.

Notification Switch

Would you like to follow the 'University physics volume 3' conversation and receive update notifications?

Ask