<< Chapter < Page Chapter >> Page >
By the end of this section, you will be able to:
  • Describe the combined effect of interference and diffraction with two slits, each with finite width
  • Determine the relative intensities of interference fringes within a diffraction pattern
  • Identify missing orders, if any

When we studied interference in Young’s double-slit experiment, we ignored the diffraction effect in each slit. We assumed that the slits were so narrow that on the screen you saw only the interference of light from just two point sources. If the slit is smaller than the wavelength, then [link] (a) shows that there is just a spreading of light and no peaks or troughs on the screen. Therefore, it was reasonable to leave out the diffraction effect in that chapter. However, if you make the slit wider, [link] (b) and (c) show that you cannot ignore diffraction. In this section, we study the complications to the double-slit experiment that arise when you also need to take into account the diffraction effect of each slit.

To calculate the diffraction pattern for two (or any number of) slits, we need to generalize the method we just used for a single slit. That is, across each slit, we place a uniform distribution of point sources that radiate Huygens wavelets, and then we sum the wavelets from all the slits. This gives the intensity at any point on the screen. Although the details of that calculation can be complicated, the final result is quite simple:

Two-slit diffraction pattern

The diffraction pattern of two slits of width D that are separated by a distance d is the interference pattern of two point sources separated by d multiplied by the diffraction pattern of a slit of width D .

In other words, the locations of the interference fringes are given by the equation d sin θ = m λ , the same as when we considered the slits to be point sources, but the intensities of the fringes are now reduced by diffraction effects, according to [link] . [Note that in the chapter on interference, we wrote d sin θ = m λ and used the integer m to refer to interference fringes. [link] also uses m , but this time to refer to diffraction minima. If both equations are used simultaneously, it is good practice to use a different variable (such as n ) for one of these integers in order to keep them distinct.]

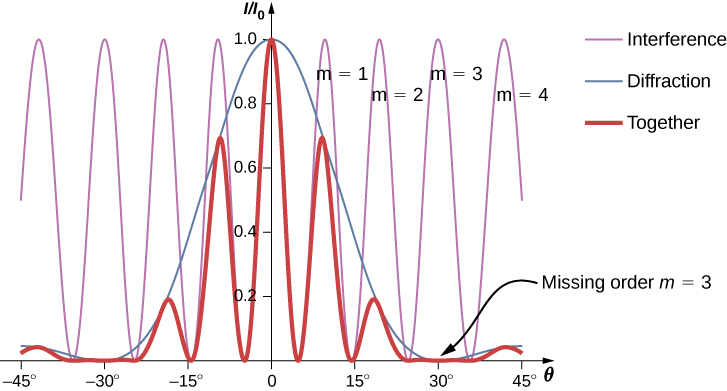
Interference and diffraction effects operate simultaneously and generally produce minima at different angles. This gives rise to a complicated pattern on the screen, in which some of the maxima of interference from the two slits are missing if the maximum of the interference is in the same direction as the minimum of the diffraction. We refer to such a missing peak as a missing order    . One example of a diffraction pattern on the screen is shown in [link] . The solid line with multiple peaks of various heights is the intensity observed on the screen. It is a product of the interference pattern of waves from separate slits and the diffraction of waves from within one slit.

Figure shows a graph of I by I0 versus theta. Three curves are shown on the graph. Interference curve has a smaller wavelength. Diffraction curve has a larger wavelength and a y value of 1 at x equal to 0. Resultant curve has the same wavelength as the interference and its amplitude is modified according to the diffraction curve. Each wave crest of the interference wave is labeled m equal to 1, m equal to 2 and so on. The diffraction wave has a zero at m equal to 3, and theta equal to 30 degrees. Hence, the resultant wave, too, has a zero. This is labeled missing order m equal to 3.
Diffraction from a double slit. The purple line with peaks of the same height are from the interference of the waves from two slits; the blue line with one big hump in the middle is the diffraction of waves from within one slit; and the thick red line is the product of the two, which is the pattern observed on the screen. The plot shows the expected result for a slit width D = 2 λ and slit separation d = 6 λ . The maximum of m = ± 3 order for the interference is missing because the minimum of the diffraction occurs in the same direction.

Questions & Answers

Ayele, K., 2003. Introductory Economics, 3rd ed., Addis Ababa.
Widad Reply
can you send the book attached ?
Ariel
?
Ariel
What is economics
Widad Reply
the study of how humans make choices under conditions of scarcity
AI-Robot
U(x,y) = (x×y)1/2 find mu of x for y
Desalegn Reply
U(x,y) = (x×y)1/2 find mu of x for y
Desalegn
what is ecnomics
Jan Reply
this is the study of how the society manages it's scarce resources
Belonwu
what is macroeconomic
John Reply
macroeconomic is the branch of economics which studies actions, scale, activities and behaviour of the aggregate economy as a whole.
husaini
etc
husaini
difference between firm and industry
husaini Reply
what's the difference between a firm and an industry
Abdul
firm is the unit which transform inputs to output where as industry contain combination of firms with similar production 😅😅
Abdulraufu
Suppose the demand function that a firm faces shifted from Qd  120 3P to Qd  90  3P and the supply function has shifted from QS  20  2P to QS 10  2P . a) Find the effect of this change on price and quantity. b) Which of the changes in demand and supply is higher?
Toofiq Reply
explain standard reason why economic is a science
innocent Reply
factors influencing supply
Petrus Reply
what is economic.
Milan Reply
scares means__________________ends resources. unlimited
Jan
economics is a science that studies human behaviour as a relationship b/w ends and scares means which have alternative uses
Jan
calculate the profit maximizing for demand and supply
Zarshad Reply
Why qualify 28 supplies
Milan
what are explicit costs
Nomsa Reply
out-of-pocket costs for a firm, for example, payments for wages and salaries, rent, or materials
AI-Robot
concepts of supply in microeconomics
David Reply
economic overview notes
Amahle Reply
identify a demand and a supply curve
Salome Reply
i don't know
Parul
there's a difference
Aryan
Demand curve shows that how supply and others conditions affect on demand of a particular thing and what percent demand increase whith increase of supply of goods
Israr
Hi Sir please how do u calculate Cross elastic demand and income elastic demand?
Abari
Got questions? Join the online conversation and get instant answers!
Jobilize.com Reply
Practice Key Terms 2

Get Jobilize Job Search Mobile App in your pocket Now!

Get it on Google Play Download on the App Store Now


Source:  OpenStax, University physics volume 3. OpenStax CNX. Nov 04, 2016 Download for free at http://cnx.org/content/col12067/1.4
Google Play and the Google Play logo are trademarks of Google Inc.

Notification Switch

Would you like to follow the 'University physics volume 3' conversation and receive update notifications?

Ask