<< Chapter < Page Chapter >> Page >
By the end of this section, you will be able to:
  • Describe the process of nuclear fission in terms of its product and reactants
  • Calculate the energies of particles produced by a fission reaction
  • Explain the fission concept in the context of fission bombs and nuclear reactions

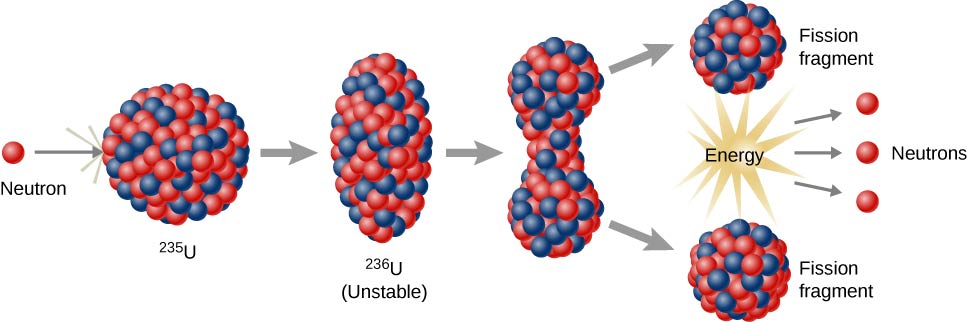
In 1934, Enrico Fermi bombarded chemical elements with neutrons in order to create isotopes of other elements. He assumed that bombarding uranium with neutrons would make it unstable and produce a new element. Unfortunately, Fermi could not determine the products of the reaction. Several years later, Otto Hahn and Fritz Strassman reproduced these experiments and discovered that the products of these reactions were smaller nuclei. From this, they concluded that the uranium nucleus had split into two smaller nuclei.

The splitting of a nucleus is called fission    . Interestingly, U-235 fission does not always produce the same fragments. Example fission reactions include:

0 1 n + 92 235 U 56 141 B a + 36 92 K r + 3 0 1 n + Q , 0 1 n + 92 235 U 54 140 X e + 38 94 S r + 2 0 1 n + Q , 0 1 n + 92 235 U 50 132 S n + 42 101 M o + 3 0 1 n + Q .

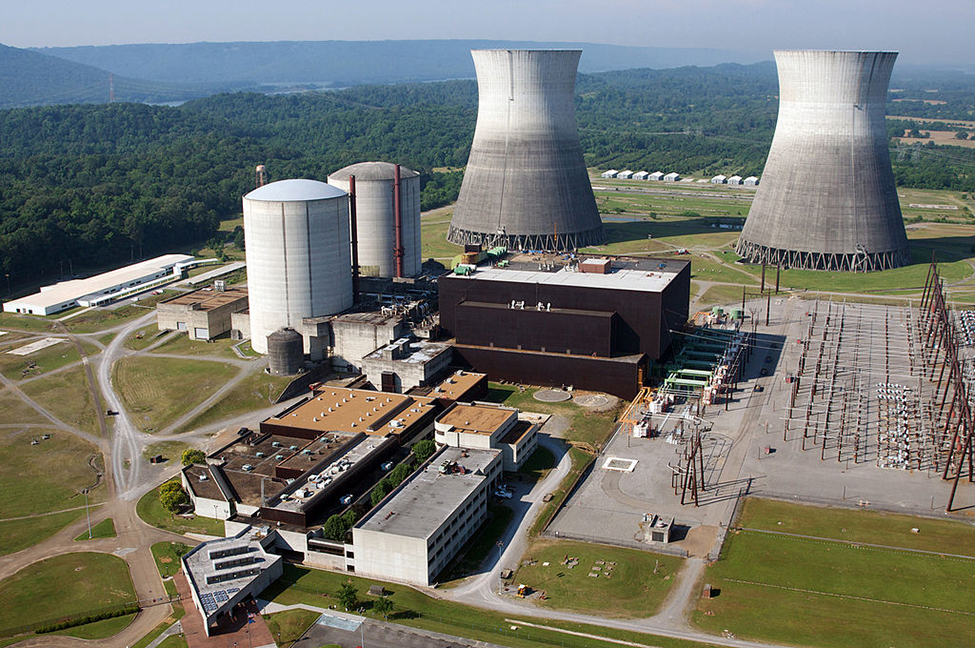
In each case, the sum of the masses of the product nuclei are less than the masses of the reactants, so the fission of uranium is an exothermic process ( Q > 0 ) . This is the idea behind the use of fission reactors as sources of energy ( [link] ). The energy carried away by the reaction takes the form of particles with kinetic energy. The percent yield of fragments from a U-235 fission is given in [link] .

An aerial photograph of The Phillipsburg Nuclear Power Plant.
The Phillipsburg Nuclear Power Plant in Germany uses a fission reactor to generate electricity.
A graph of percentage yield versus mass number A of fission fragment. The graph has two peaks at values A approximately equal to 95 and at A approximately equal to 137. There is a dip in the graph at A approximately equal to 118. The enclosed area under the graph is labeled 235 U Fission Fragments.
In this graph of fission fragments from U-235, the peaks in the graph indicate nuclei that are produced in the greatest abundance by the fission process.

Energy changes in a nuclear fission reaction can be understood in terms of the binding energy per nucleon curve ( [link] ). The BEN value for uranium ( A = 236 ) is slightly lower than its daughter nuclei, which lie closer to the iron (Fe) peak. This means that nucleons in the nuclear fragments are more tightly bound than those in the U-235 nucleus. Therefore, a fission reaction results in a drop in the average energy of a nucleon. This energy is carried away by high-energy neutrons.

Niels Bohr and John Wheeler developed the liquid drop model    to understand the fission process. According to this model, firing a neutron at a nucleus is analogous to disturbing a droplet of water ( [link] ). The analogy works because short-range forces between nucleons in a nucleus are similar to the attractive forces between water molecules in a water droplet. In particular, forces between nucleons at the surface of the nucleus result in a surface tension similar to that of a water droplet. A neutron fired into a uranium nucleus can set the nucleus into vibration. If this vibration is violent enough, the nucleus divides into smaller nuclei and also emits two or three individual neutrons.

The process of fission is shown in stages. A neutron strikes the circular nucleus of 235 U. The nucleus becomes oval shaped, labeled 236 U, unstable. Next, it develops the beginnings of a fissure in the middle. It then splits into two nuclei, each labeled fission fragment. This last stage also releases energy and neutrons.
In the liquid drop model of nuclear fission, the uranium nucleus is split into two lighter nuclei by a high-energy neutron.

U-235 fission can produce a chain reaction . In a compound consisting of many U-235 nuclei, neutrons in the decay of one U-235 nucleus can initiate the fission of additional U-235 nuclei ( [link] ). This chain reaction can proceed in a controlled manner, as in a nuclear reactor at a power plant, or proceed uncontrollably, as in an explosion.

Questions & Answers

how do you get the 2/50
Abba Reply
number of sport play by 50 student construct discrete data
Aminu Reply
width of the frangebany leaves on how to write a introduction
Theresa Reply
Solve the mean of variance
Veronica Reply
Step 1: Find the mean. To find the mean, add up all the scores, then divide them by the number of scores. ... Step 2: Find each score's deviation from the mean. ... Step 3: Square each deviation from the mean. ... Step 4: Find the sum of squares. ... Step 5: Divide the sum of squares by n – 1 or N.
kenneth
what is error
Yakuba Reply
Is mistake done to something
Vutshila
Hy
anas
hy
What is the life teble
anas
hy
Jibrin
statistics is the analyzing of data
Tajudeen Reply
what is statics?
Zelalem Reply
how do you calculate mean
Gloria Reply
diveving the sum if all values
Shaynaynay
let A1,A2 and A3 events be independent,show that (A1)^c, (A2)^c and (A3)^c are independent?
Fisaye Reply
what is statistics
Akhisani Reply
data collected all over the world
Shaynaynay
construct a less than and more than table
Imad Reply
The sample of 16 students is taken. The average age in the sample was 22 years with astandard deviation of 6 years. Construct a 95% confidence interval for the age of the population.
Aschalew Reply
Bhartdarshan' is an internet-based travel agency wherein customer can see videos of the cities they plant to visit. The number of hits daily is a normally distributed random variable with a mean of 10,000 and a standard deviation of 2,400 a. what is the probability of getting more than 12,000 hits? b. what is the probability of getting fewer than 9,000 hits?
Akshay Reply
Bhartdarshan'is an internet-based travel agency wherein customer can see videos of the cities they plan to visit. The number of hits daily is a normally distributed random variable with a mean of 10,000 and a standard deviation of 2,400. a. What is the probability of getting more than 12,000 hits
Akshay
1
Bright
Sorry i want to learn more about this question
Bright
Someone help
Bright
a= 0.20233 b=0.3384
Sufiyan
a
Shaynaynay
How do I interpret level of significance?
Mohd Reply
It depends on your business problem or in Machine Learning you could use ROC- AUC cruve to decide the threshold value
Shivam
how skewness and kurtosis are used in statistics
Owen Reply
yes what is it
Taneeya
Got questions? Join the online conversation and get instant answers!
Jobilize.com Reply
Practice Key Terms 5

Get Jobilize Job Search Mobile App in your pocket Now!

Get it on Google Play Download on the App Store Now


Source:  OpenStax, University physics volume 3. OpenStax CNX. Nov 04, 2016 Download for free at http://cnx.org/content/col12067/1.4
Google Play and the Google Play logo are trademarks of Google Inc.

Notification Switch

Would you like to follow the 'University physics volume 3' conversation and receive update notifications?

Ask