<< Chapter < Page Chapter >> Page >

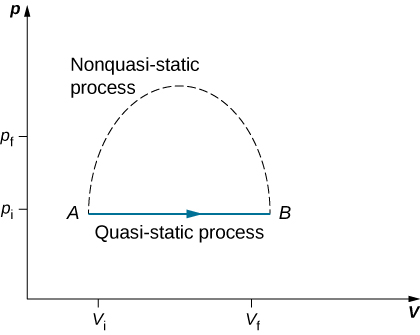
Since quasi-static processes cannot be completely realized for any finite change of the system, all processes in nature are non-quasi-static. Examples of quasi-static and non-quasi-static processes are shown in [link] . Despite the fact that all finite changes must occur essentially non-quasi-statically at some stage of the change, we can imagine performing infinitely many quasi-static process corresponding to every quasi-static process. Since quasi-static processes can be analyzed analytically, we mostly study quasi-static processes in this book. We have already seen that in a quasi-static process the work by a gas is given by pdV .

The figure is a plot of pressure, p, on the vertical axis as a function of volume, V, on the horizontal axis. Two pressures, p f greater than p i, are marked on the vertical axis. Two volumes, V f greater than V i are marked on the horizontal axis. Two points, A at V i, p i, and B at the final V f, p i, are shown and are connected by a straight horizontal line with a rightward arrow from A to B. The line is labeled Quasi-static process. A dashed line goes up from A, curves to reach a maximum, and curves back down to B. This dashed line is labeled nonquasi-static process.
Quasi-static and non-quasi-static processes between states A and B of a gas. In a quasi-static process, the path of the process between A and B can be drawn in a state diagram since all the states that the system goes through are known. In a non-quasi-static process, the states between A and B are not known, and hence no path can be drawn. It may follow the dashed line as shown in the figure or take a very different path.

Isothermal processes

An isothermal process    is a change in the state of the system at a constant temperature. This process is accomplished by keeping the system in thermal equilibrium with a large heat bath during the process. Recall that a heat bath is an idealized “infinitely” large system whose temperature does not change. In practice, the temperature of a finite bath is controlled by either adding or removing a finite amount of energy as the case may be.

As an illustration of an isothermal process, consider a cylinder of gas with a movable piston immersed in a large water tank whose temperature is maintained constant. Since the piston is freely movable, the pressure inside P in is balanced by the pressure outside P out by some weights on the piston, as in [link] .

The figure illustrates a large insulated container filled with fluid. This fluid is labeled as the constant T heat bath. Inside the heat bath is a smaller container filled with gas. The smaller gas container is capped by a piston that has weights on top of it. The inside of the smaller container is the system. A double headed arrow across the smaller container’s walls labeled “heat” indicates that heat can flow between the bath and the system. An upward arrow inside the system points up at the bottom of the piston and is labeled p in. A downward arrow outside the system points down at the top of the piston and is labeled p out. A second downward arrow points at the top of the piston where the weights are stacked.
Expanding a system at a constant temperature. Removing weights on the piston leads to an imbalance of forces on the piston, which causes the piston to move up. As the piston moves up, the temperature is lowered momentarily, which causes heat to flow from the heat bath to the system. The energy to move the piston eventually comes from the heat bath.

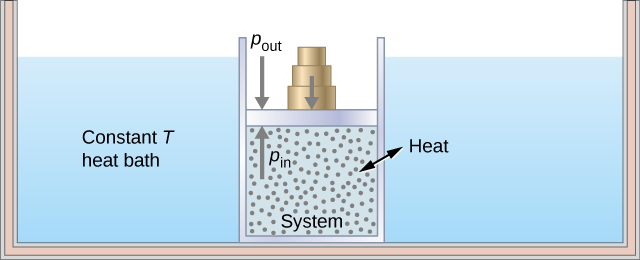
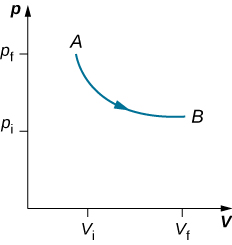
As weights on the piston are removed, an imbalance of forces on the piston develops. The net nonzero force on the piston would cause the piston to accelerate, resulting in an increase in volume. The expansion of the gas cools the gas to a lower temperature, which makes it possible for the heat to enter from the heat bath into the system until the temperature of the gas is reset to the temperature of the heat bath. If weights are removed in infinitesimal steps, the pressure in the system decreases infinitesimally slowly. This way, an isothermal process can be conducted quasi-statically. An isothermal line on a ( p , V ) diagram is represented by a curved line from starting point A to finishing point B , as seen in [link] . For an ideal gas, an isothermal process is hyperbolic, since for an ideal gas at constant temperature, p 1 V .

The figure is a plot of pressure, p, on the vertical axis as a function of volume, V, on the horizontal axis. Two pressures, p f greater than p i, are marked on the vertical axis. Two volumes, V f greater than V i are marked on the horizontal axis. Two points, A at V i, p f, and B at the final V f, p i, are shown and are connected by a curve that is monotonically decreasing and concave up. An arrow indicates the direction on the curve is from A toward B.
An isothermal expansion from a state labeled A to another state labeled B on a pV diagram. The curve represents the relation between pressure and volume in an ideal gas at constant temperature.
Practice Key Terms 7

Get Jobilize Job Search Mobile App in your pocket Now!

Get it on Google Play Download on the App Store Now


Source:  OpenStax, University physics volume 2. OpenStax CNX. Oct 06, 2016 Download for free at http://cnx.org/content/col12074/1.3
Google Play and the Google Play logo are trademarks of Google Inc.

Notification Switch

Would you like to follow the 'University physics volume 2' conversation and receive update notifications?

Ask