<< Chapter < Page Chapter >> Page >
The figure has three parts, each part showing a tire connected to a pressure gauge at the start and at the end of a stage of inflating the tire, showing pressures P and P prime respectively. In part a, the tire pressure is initially zero. After some air is added, represented by an arrow labeled Add air, the pressure rises to slightly above zero. In part b, the tire pressure is initially at the half-way mark. After some air is added, represented by an arrow labeled Add air, the pressure rises to the three-fourths mark. In part c, the tire pressure is initially at the three-fourths mark. After the temperature is raised, represented by an arrow labeled Increase temperature, the pressure rises to nearly the full mark.
(a) When air is pumped into a deflated tire, its volume first increases without much increase in pressure. (b) When the tire is filled to a certain point, the tire walls resist further expansion, and the pressure increases with more air. (c) Once the tire is inflated, its pressure increases with temperature.

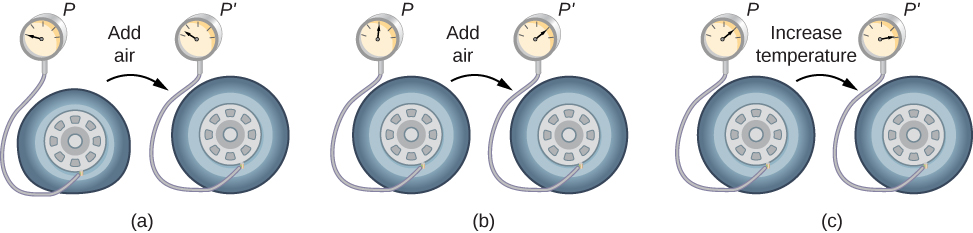
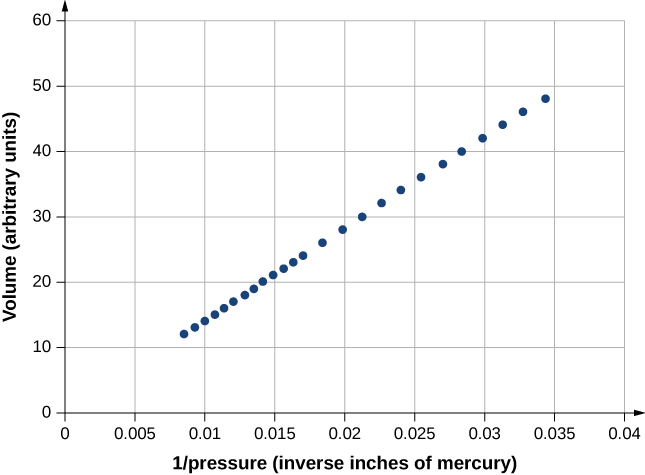
[link] shows data from the experiments of Robert Boyle (1627–1691), illustrating what is now called Boyle’s law : At constant temperature and number of molecules, the absolute pressure of a gas and its volume are inversely proportional. (Recall from Fluid Mechanics that the absolute pressure is the true pressure and the gauge pressure is the absolute pressure minus the ambient pressure, typically atmospheric pressure.) The graph in [link] displays this relationship as an inverse proportionality of volume to pressure.

This figure is a graph of the volume (in arbitrary units) on the vertical axis as a function of one over the pressure (in inverse inches of mercury) on the horizontal axis. The horizontal scale runs from 0 to 0.04. The vertical scale runs from 0 to 60. The graph shows data points that appear to lie on a straight line, starting inverse pressure of about 0.008 inverse inches of mercury and volume of about 11, and ending at an inverse pressure of just under 0.035 inverse inches of mercury and volume of just under 50. The data points are closely spaced at the lower end and get farther apart as the inverse pressure and volume increase.
Robert Boyle and his assistant found that volume and pressure are inversely proportional. Here their data are plotted as V versus 1/ p ; the linearity of the graph shows the inverse proportionality. The number shown as the volume is actually the height in inches of air in a cylindrical glass tube. The actual volume was that height multiplied by the cross-sectional area of the tube, which Boyle did not publish. The data are from Boyle’s book A Defence of the Doctrine Touching the Spring and Weight of the Air …, p. 60. http://bvpb.mcu.es/en/consulta/registro.cmd?id=406806

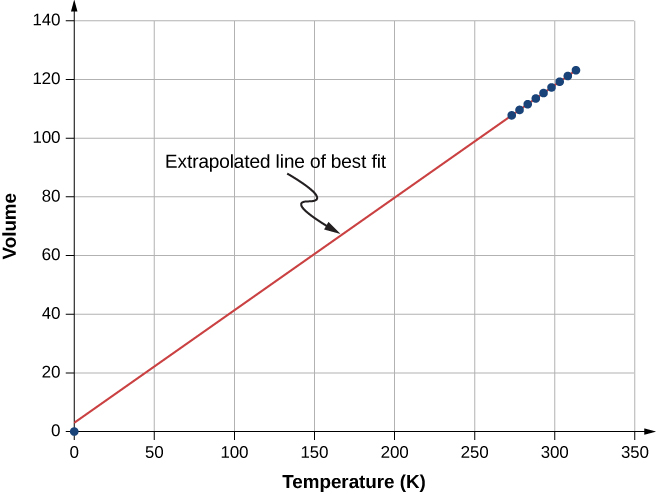
[link] shows experimental data illustrating what is called Charles’s law , after Jacques Charles (1746–1823). Charles’s law states that at constant pressure and number of molecules, the volume of a gas is proportional to its absolute temperature.

This figure is a graph of the volume (in arbitrary units) on the vertical axis as a function of temperature (in Kelvin) on the horizontal axis. The horizontal scale runs from 0 to 350 K and the vertical scale from 0 to 140. Nine data points are shown. The data points lie on a straight line and are evenly spaced. The data extends from 273 K and volume of 108 to 313 K and volume of 123. A line labeled Extrapolated line of best fit is drawn through the data and back to 0 K. The hits the vertical axis just above the origin.
Experimental data showing that at constant pressure, volume is approximately proportional to temperature. The best-fit line passes approximately through the origin. http://chemed.chem.purdue.edu/genchem/history/charles.html

Similar is Amonton’s or Gay-Lussac’s law , which states that at constant volume and number of molecules, the pressure is proportional to the temperature. That law is the basis of the constant-volume gas thermometer, discussed in the previous chapter. (The histories of these laws and the appropriate credit for them are more complicated than can be discussed here.)

It is known experimentally that for gases at low density (such that their molecules occupy a negligible fraction of the total volume) and at temperatures well above the boiling point, these proportionalities hold to a good approximation. Not surprisingly, with the other quantities held constant, either pressure or volume is proportional to the number of molecules. More surprisingly, when the proportionalities are combined into a single equation, the constant of proportionality is independent of the composition of the gas. The resulting equation for all gases applies in the limit of low density and high temperature; it’s the same for oxygen as for helium or uranium hexafluoride. A gas at that limit is called an ideal gas    ; it obeys the ideal gas law    , which is also called the equation of state of an ideal gas.

Get Jobilize Job Search Mobile App in your pocket Now!

Get it on Google Play Download on the App Store Now


Source:  OpenStax, University physics volume 2. OpenStax CNX. Oct 06, 2016 Download for free at http://cnx.org/content/col12074/1.3
Google Play and the Google Play logo are trademarks of Google Inc.

Notification Switch

Would you like to follow the 'University physics volume 2' conversation and receive update notifications?

Ask