<< Chapter < Page Chapter >> Page >
By the end of this section, you will be able to:
  • Describe phase transitions and equilibrium between phases
  • Solve problems involving latent heat
  • Solve calorimetry problems involving phase changes

Phase transitions play an important theoretical and practical role in the study of heat flow. In melting (or “fusion”), a solid turns into a liquid; the opposite process is freezing . In evaporation , a liquid turns into a gas; the opposite process is condensation .

A substance melts or freezes at a temperature called its melting point, and boils (evaporates rapidly) or condenses at its boiling point. These temperatures depend on pressure. High pressure favors the denser form, so typically, high pressure raises the melting point and boiling point, and low pressure lowers them. For example, the boiling point of water is 100 ° C at 1.00 atm. At higher pressure, the boiling point is higher, and at lower pressure, it is lower. The main exception is the melting and freezing of water, discussed in the next section.

Phase diagrams

The phase of a given substance depends on the pressure and temperature. Thus, plots of pressure versus temperature showing the phase in each region provide considerable insight into thermal properties of substances. Such a pT graph is called a phase diagram    .

[link] shows the phase diagram for water. Using the graph, if you know the pressure and temperature, you can determine the phase of water. The solid curves—boundaries between phases—indicate phase transitions, that is, temperatures and pressures at which the phases coexist. For example, the boiling point of water is 100 ° C at 1.00 atm. As the pressure increases, the boiling temperature rises gradually to 374 ° C at a pressure of 218 atm. A pressure cooker (or even a covered pot) cooks food faster than an open pot, because the water can exist as a liquid at temperatures greater than 100 ° C without all boiling away. (As we’ll see in the next section, liquid water conducts heat better than steam or hot air.) The boiling point curve ends at a certain point called the critical point    —that is, a critical temperature    , above which the liquid and gas phases cannot be distinguished; the substance is called a supercritical fluid . At sufficiently high pressure above the critical point, the gas has the density of a liquid but does not condense. Carbon dioxide, for example, is supercritical at all temperatures above 31.0 ° C . Critical pressure is the pressure of the critical point.

Graph of pressure P in atmosphere versus temperature T in degree Celsius for water. The curve starts with going up and right to a point labeled triple point. This is at 0.006 atm and 0.01 degree C. From here, the curve diverges into two branches. One goes up and left and is almost vertical. The other goes up and right. On the branch going up and right is a point at 1 atm and 100 degrees C. Further up on the same branch is a point labeled critical point. This is at 218 atm and 374 degrees C. The area to the left of the left branch is labeled solid. The area between two branches is labeled liquid. The area to the right of the right branch is labeled vapour. The curve to the lower left of the triple point is labeled sublimation, the branch to the upper left of the triple point is labeled melting, and the branch to the upper right of the triple point is labeled boiling.
The phase diagram ( pT graph) for water shows solid (s), liquid (l), and vapor (v) phases. At temperatures and pressure above those of the critical point, there is no distinction between liquid and vapor. Note that the axes are nonlinear and the graph is not to scale. This graph is simplified—it omits several exotic phases of ice at higher pressures. The phase diagram of water is unusual because the melting-point curve has a negative slope, showing that you can melt ice by increasing the pressure.

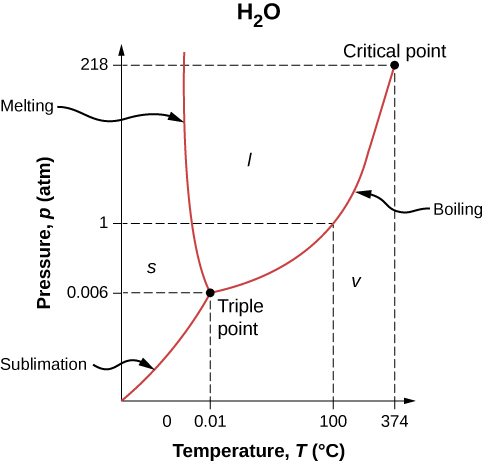
Similarly, the curve between the solid and liquid regions in [link] gives the melting temperature at various pressures. For example, the melting point is 0 ° C at 1.00 atm, as expected. Water has the unusual property that ice is less dense than liquid water at the melting point, so at a fixed temperature, you can change the phase from solid (ice) to liquid (water) by increasing the pressure. That is, the melting temperature of ice falls with increased pressure, as the phase diagram shows. For example, when a car is driven over snow, the increased pressure from the tires melts the snowflakes; afterwards, the water refreezes and forms an ice layer.

Questions & Answers

What are the factors that affect demand for a commodity
Florence Reply
differentiate between demand and supply giving examples
Lambiv Reply
differentiated between demand and supply using examples
Lambiv
what is labour ?
Lambiv
how will I do?
Venny Reply
how is the graph works?I don't fully understand
Rezat Reply
information
Eliyee
devaluation
Eliyee
t
WARKISA
hi guys good evening to all
Lambiv
multiple choice question
Aster Reply
appreciation
Eliyee
explain perfect market
Lindiwe Reply
In economics, a perfect market refers to a theoretical construct where all participants have perfect information, goods are homogenous, there are no barriers to entry or exit, and prices are determined solely by supply and demand. It's an idealized model used for analysis,
Ezea
What is ceteris paribus?
Shukri Reply
other things being equal
AI-Robot
When MP₁ becomes negative, TP start to decline. Extuples Suppose that the short-run production function of certain cut-flower firm is given by: Q=4KL-0.6K2 - 0.112 • Where is quantity of cut flower produced, I is labour input and K is fixed capital input (K-5). Determine the average product of lab
Kelo
Extuples Suppose that the short-run production function of certain cut-flower firm is given by: Q=4KL-0.6K2 - 0.112 • Where is quantity of cut flower produced, I is labour input and K is fixed capital input (K-5). Determine the average product of labour (APL) and marginal product of labour (MPL)
Kelo
yes,thank you
Shukri
Can I ask you other question?
Shukri
what is monopoly mean?
Habtamu Reply
What is different between quantity demand and demand?
Shukri Reply
Quantity demanded refers to the specific amount of a good or service that consumers are willing and able to purchase at a give price and within a specific time period. Demand, on the other hand, is a broader concept that encompasses the entire relationship between price and quantity demanded
Ezea
ok
Shukri
how do you save a country economic situation when it's falling apart
Lilia Reply
what is the difference between economic growth and development
Fiker Reply
Economic growth as an increase in the production and consumption of goods and services within an economy.but Economic development as a broader concept that encompasses not only economic growth but also social & human well being.
Shukri
production function means
Jabir
What do you think is more important to focus on when considering inequality ?
Abdisa Reply
any question about economics?
Awais Reply
sir...I just want to ask one question... Define the term contract curve? if you are free please help me to find this answer 🙏
Asui
it is a curve that we get after connecting the pareto optimal combinations of two consumers after their mutually beneficial trade offs
Awais
thank you so much 👍 sir
Asui
In economics, the contract curve refers to the set of points in an Edgeworth box diagram where both parties involved in a trade cannot be made better off without making one of them worse off. It represents the Pareto efficient allocations of goods between two individuals or entities, where neither p
Cornelius
In economics, the contract curve refers to the set of points in an Edgeworth box diagram where both parties involved in a trade cannot be made better off without making one of them worse off. It represents the Pareto efficient allocations of goods between two individuals or entities,
Cornelius
Suppose a consumer consuming two commodities X and Y has The following utility function u=X0.4 Y0.6. If the price of the X and Y are 2 and 3 respectively and income Constraint is birr 50. A,Calculate quantities of x and y which maximize utility. B,Calculate value of Lagrange multiplier. C,Calculate quantities of X and Y consumed with a given price. D,alculate optimum level of output .
Feyisa Reply
Answer
Feyisa
c
Jabir
the market for lemon has 10 potential consumers, each having an individual demand curve p=101-10Qi, where p is price in dollar's per cup and Qi is the number of cups demanded per week by the i th consumer.Find the market demand curve using algebra. Draw an individual demand curve and the market dema
Gsbwnw Reply
suppose the production function is given by ( L, K)=L¼K¾.assuming capital is fixed find APL and MPL. consider the following short run production function:Q=6L²-0.4L³ a) find the value of L that maximizes output b)find the value of L that maximizes marginal product
Abdureman
Got questions? Join the online conversation and get instant answers!
Jobilize.com Reply

Get Jobilize Job Search Mobile App in your pocket Now!

Get it on Google Play Download on the App Store Now


Source:  OpenStax, University physics volume 2. OpenStax CNX. Oct 06, 2016 Download for free at http://cnx.org/content/col12074/1.3
Google Play and the Google Play logo are trademarks of Google Inc.

Notification Switch

Would you like to follow the 'University physics volume 2' conversation and receive update notifications?

Ask