

| << Chapter < Page | Chapter >> Page > |
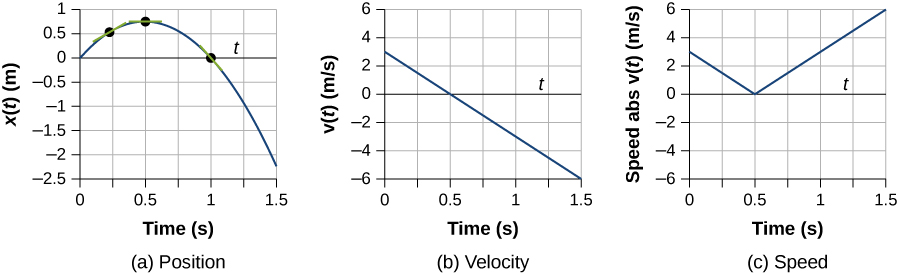
Check Your Understanding The position of an object as a function of time is . (a) What is the velocity of the object as a function of time? (b) Is the velocity ever positive? (c) What are the velocity and speed at t = 1.0 s?
(a) Taking the derivative of x ( t ) gives v ( t ) = −6 t m/s. (b) No, because time can never be negative. (c) The velocity is v (1.0 s) = −6 m/s and the speed is .
There is a distinction between average speed and the magnitude of average velocity. Give an example that illustrates the difference between these two quantities.
Average speed is the total distance traveled divided by the elapsed time. If you go for a walk, leaving and returning to your home, your average speed is a positive number. Since Average velocity = Displacement/Elapsed time, your average velocity is zero.
Does the speedometer of a car measure speed or velocity?
If you divide the total distance traveled on a car trip (as determined by the odometer) by the elapsed time of the trip, are you calculating average speed or magnitude of average velocity? Under what circumstances are these two quantities the same?
Average speed. They are the same if the car doesn’t reverse direction.
How are instantaneous velocity and instantaneous speed related to one another? How do they differ?
A woodchuck runs 20 m to the right in 5 s, then turns and runs 10 m to the left in 3 s. (a) What is the average velocity of the woodchuck? (b) What is its average speed?
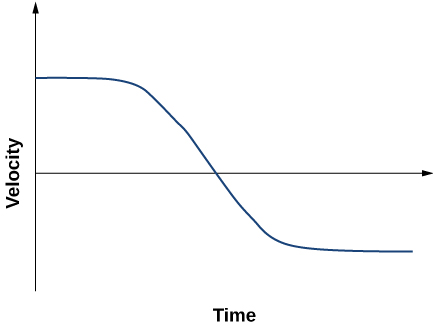
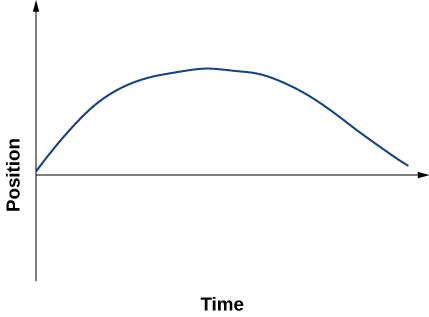
Sketch the velocity-versus-time graph from the following position-versus-time graph.

Sketch the velocity-versus-time graph from the following position-versus-time graph.

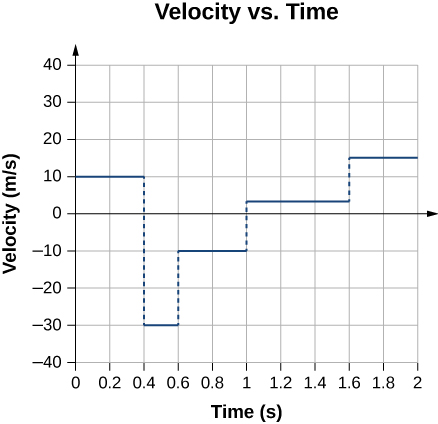
Given the following velocity-versus-time graph, sketch the position-versus-time graph.
An object has a position function x ( t ) = 5 t m. (a) What is the velocity as a function of time? (b) Graph the position function and the velocity function.
A particle moves along the x- axis according to . (a) What is the instantaneous velocity at t = 2 s and t = 3 s? (b) What is the instantaneous speed at these times? (c) What is the average velocity between t = 2 s and t = 3 s?
a. ; v (2 s) = 2 m/s, v (3 s) = −2 m/s; b. ; (c)
Unreasonable results. A particle moves along the x -axis according to . At what time is the velocity of the particle equal to zero? Is this reasonable?
Notification Switch
Would you like to follow the 'University physics volume 1' conversation and receive update notifications?

|
|

|
|

|
|

|
|

|
|

|
|

|
|
|
|
|

|
|

|