<< Chapter < Page Chapter >> Page >

Oscillations about an equilibrium position

We have just considered the energy of SHM as a function of time. Another interesting view of the simple harmonic oscillator is to consider the energy as a function of position. [link] shows a graph of the energy versus position of a system undergoing SHM.

Graph of energy E in Joules on the vertical axis versus position x in meters on the horizontal axis. The horizontal axis had x=0 labeled as the equilibrium position with F=0. Positions x=-A and x=+A are labeled as turning points. A concave down parabola in red, labeled as K, has its maximum value of E=E total at x=0 and is zero at x=-A and x=+A. A horizontal green line at a constant E value of E total is labeled as E total. A concave up parabola in blue, labeled as U, intersects the green line with a value of E=E total at x=-A and x=+A and is zero at x=0. The region of the graph to the left of x=0 is labeled with a red arrow pointing to the right and the equation F equals minus the derivative of U with respect to x. The region of the graph to the right of x=0 is labeled with a red arrow pointing to the left and the equation F equals minus the derivative of U with respect to x.
A graph of the kinetic energy (red), potential energy (blue), and total energy (green) of a simple harmonic oscillator. The force is equal to F = d U d x . The equilibrium position is shown as a black dot and is the point where the force is equal to zero. The force is positive when x < 0 , negative when x > 0 , and equal to zero when x = 0 .

The potential energy curve in [link] resembles a bowl. When a marble is placed in a bowl, it settles to the equilibrium position at the lowest point of the bowl ( x = 0 ) . This happens because a restoring force    points toward the equilibrium point. This equilibrium point is sometimes referred to as a fixed point . When the marble is disturbed to a different position ( x = + A ) , the marble oscillates around the equilibrium position. Looking back at the graph of potential energy, the force can be found by looking at the slope of the potential energy graph ( F = d U d x ) . Since the force on either side of the fixed point points back toward the equilibrium point, the equilibrium point is called a stable equilibrium point    . The points x = A and x = A are called the turning points . (See Potential Energy and Conservation of Energy .)

Stability is an important concept. If an equilibrium point is stable, a slight disturbance of an object that is initially at the stable equilibrium point will cause the object to oscillate around that point. The stable equilibrium point occurs because the force on either side is directed toward it. For an unstable equilibrium point, if the object is disturbed slightly, it does not return to the equilibrium point.

Consider the marble in the bowl example. If the bowl is right-side up, the marble, if disturbed slightly, will oscillate around the stable equilibrium point. If the bowl is turned upside down, the marble can be balanced on the top, at the equilibrium point where the net force is zero. However, if the marble is disturbed slightly, it will not return to the equilibrium point, but will instead roll off the bowl. The reason is that the force on either side of the equilibrium point is directed away from that point. This point is an unstable equilibrium point.

[link] shows three conditions. The first is a stable equilibrium point (a), the second is an unstable equilibrium point (b), and the last is also an unstable equilibrium point (c), because the force on only one side points toward the equilibrium point.

Three illustrations of a ball on a surface. In figure a, stable equilibrium point, the ball is inside a concave-up surface, at the bottom. A filled circle under the surface, below the ball, has two horizontal arrows labeled as F pointing toward it from either side. Gray arrows tangent to the surface are shown inside the surface, pointing down the slope, toward the ball’s position. In figure b, unstable equilibrium point, the ball is on top of a concave-down surface, at the top. An empty circle under the surface, below the ball, has two horizontal arrows labeled as F pointing away it from either side. Gray arrows tangent to the surface are shown inside the surface, pointing down the slope, away from the ball’s position. In figure c, unstable equilibrium point, the ball is on the inflection point of a surface. A half-filled circle under the surface, below the ball, has two horizontal arrows labeled as F, one on either side of the circle, both pointing to the left. Gray arrows tangent to the surface are shown inside the surface, pointing down the slope, one toward the ball and the other away from it.
Examples of equilibrium points. (a) Stable equilibrium point; (b) unstable equilibrium point; (c) unstable equilibrium point (sometimes referred to as a half-stable equilibrium point).

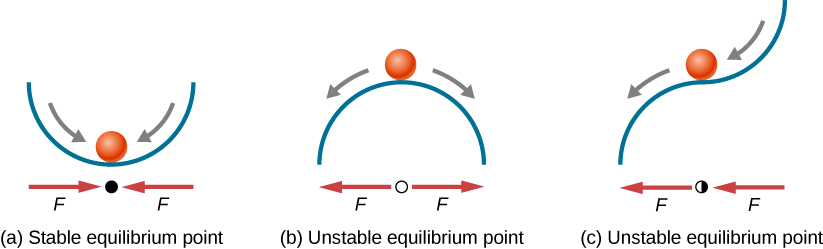
The process of determining whether an equilibrium point is stable or unstable can be formalized. Consider the potential energy curves shown in [link] . The force can be found by analyzing the slope of the graph. The force is F = d U d x . In (a), the fixed point is at x = 0.00 m . When x < 0.00 m, the force is positive. When x > 0.00 m, the force is negative. This is a stable point. In (b), the fixed point is at x = 0.00 m . When x < 0.00 m, the force is negative. When x > 0.00 m, the force is also negative. This is an unstable point.

Practice Key Terms 3

Get Jobilize Job Search Mobile App in your pocket Now!

Get it on Google Play Download on the App Store Now


Source:  OpenStax, University physics volume 1. OpenStax CNX. Sep 19, 2016 Download for free at http://cnx.org/content/col12031/1.5
Google Play and the Google Play logo are trademarks of Google Inc.

Notification Switch

Would you like to follow the 'University physics volume 1' conversation and receive update notifications?

Ask